Palo Alto Networks, Inc. (NASDAQ:PANW) is a prominent American cybersecurity enterprise consisting of three distinct reportable segments: Product, Subscription, and Support. This analysis delves into the company’s ascension to market leadership in the cybersecurity industry in recent years, aiming to identify the key factors underlying its notable increase in market share, by focusing on its strengths in network security such as security hardware and network security software.
Secured Cybersecurity Market Leadership in 2022
|
Revenue by Segment ($ mln) (FY Ending July) |
2018 |
2019 |
2020 |
2021 |
2022 |
2023F |
6-year Historical Average |
|
Product |
880 |
1,096 |
1,064 |
1,120 |
1,363 |
1,532 |
|
|
Growth Rate % (YoY) |
24.2% |
24.6% |
-2.9% |
5.3% |
21.7% |
12.4% |
13.1% |
|
Subscription |
758 |
1,033 |
1,405 |
1,899 |
2,539 |
3,393 |
|
|
Growth Rate % (YoY) |
38.1% |
36.2% |
36.1% |
35.1% |
33.7% |
33.6% |
38.8% |
|
Support |
636 |
771 |
939 |
1,237 |
1,599 |
2,018 |
|
|
Growth Rate % (YoY) |
27.7% |
21.2% |
21.8% |
31.7% |
29.3% |
26.2% |
29% |
|
Total |
2,274 |
2,900 |
3,408 |
4,256 |
5,502 |
6,943 |
|
|
Growth Rate % (YoY) |
29.5% |
27.5% |
17.5% |
24.9% |
29.3% |
26.2% |
26.0% |
Source: Palo Alto, Khaveen Investments
The table above shows Palo Alto’s segment breakdown and the 6-year average growth for each segment. According to the company’s annual report, the product segment mainly consists of hardware and software network firewalls, the subscription segment consists of security software and the support segment consists of customer support, threat researchers, and security consultants. The product segment (24.8% of total revenue) grew 21.7% in FY2022, much greater compared to FY2021 (5.3%) and the average growth rate (13.1%). According to management, this is due to
…increased demand for our new generation of products, which includes customer transition from our legacy products. – Palo Alto Annual Report
The subscription segment (46.1% of total revenue) grew the most at 33.7%, which is below its average of 38.8%. The support segment (29.1% of total revenue) grew from 24.9% in FY2021 to 29.3% in 2022, but this is in line with the average of 29%.
For our forecast of its FY2023 revenues, we summed its Q1 to Q3 results for each segment and forecasted its Q4 revenues based on its past 6-year average growth for each segment. Overall, we see the company continue to grow decently for the full year in line with its historical average of 26%.
Below, we examine the market share growth for Palo Alto and its competitors in the cybersecurity space.
Company Data, Khaveen Investments
|
Cybersecurity Revenue by Company (‘CY’) |
2017 |
2018 |
2019 |
2020 |
2021 |
2022 |
Average |
|
Palo Alto Networks |
1,989 |
2,593 |
3,121 |
3,783 |
4,858 |
6,156 |
|
|
Growth Rate % (YoY) |
30.4% |
20.3% |
21.2% |
28.4% |
26.7% |
25.4% |
|
|
Fortinet (FTNT) |
1,495 |
1,805 |
2,163 |
2,594 |
3,342 |
4,417 |
|
|
Growth Rate % (YoY) |
20.7% |
19.9% |
19.9% |
28.8% |
32.2% |
24.3% |
|
|
Cisco (CSCO) |
2,228 |
2,554 |
3,032 |
3,277 |
3,476 |
3,835 |
|
|
Growth Rate % (YoY) |
14.6% |
18.7% |
8.1% |
6.1% |
10.3% |
11.6% |
|
|
Symantec (now known as Gen Digital) |
4,752 |
4,768 |
2,493 |
2,752 |
3,107 |
||
|
Growth Rate % (YoY) |
0.3% |
-47.7% |
10.4% |
12.9% |
-6.0% |
||
|
Checkpoint (CKPT) |
1,855 |
1,917 |
1,995 |
2,065 |
2,167 |
2,330 |
|
|
Growth Rate % (YoY) |
3.3% |
4.1% |
3.5% |
4.9% |
7.5% |
4.7% |
|
|
CrowdStrike (CRWD) |
119 |
250 |
481 |
874 |
1,452 |
2,241 |
|
|
Growth Rate % (YoY) |
110.3% |
92.7% |
81.6% |
66.0% |
54.4% |
81.0% |
|
|
Microsoft (MSFT) |
437 |
625 |
842 |
1,115 |
1,530 |
2,199 |
|
|
Growth Rate % (YoY) |
42.9% |
34.8% |
32.4% |
37.2% |
43.8% |
38.2% |
|
|
IBM (IBM) |
2,222 |
2,358 |
1,795 |
1,806 |
1,972 |
2,180 |
|
|
Growth Rate % (YoY) |
6.1% |
-23.9% |
0.6% |
9.2% |
10.5% |
0.5% |
|
|
Okta (OKTA) |
257 |
399 |
586 |
835 |
1,300 |
1,858 |
|
|
Growth Rate % (YoY) |
55.7% |
46.8% |
42.5% |
55.7% |
42.9% |
48.7% |
|
|
Trend Micro (OTCPK:TMICF) |
1,321 |
1,464 |
1,520 |
1,686 |
1,654 |
1,705 |
|
|
Growth Rate % (YoY) |
10.8% |
3.9% |
10.9% |
-1.9% |
3.1% |
5.4% |
|
|
Zscaler (ZS) |
154 |
243 |
360 |
536 |
860 |
1,348 |
|
|
Growth Rate % (YoY) |
57.5% |
48.2% |
48.8% |
60.4% |
56.8% |
54.3% |
|
|
Others |
21,486 |
17,667 |
22,845 |
30,621 |
36,035 |
39,721 |
|
|
Growth Rate % (YoY) |
-17.8% |
29.3% |
34.0% |
17.7% |
10.2% |
14.7% |
|
|
Total |
33,561 |
36,629 |
43,511 |
51,687 |
61,399 |
71,100 |
|
|
Growth Rate % (YoY) |
9.1% |
18.8% |
18.8% |
18.8% |
15.8% |
16.3% |
Source: Company Data, Canalys, Khaveen Investments
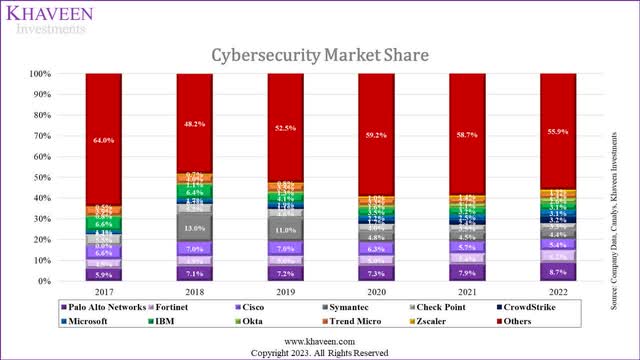
We derived the market share by taking the security revenues for each company divided by the size of the total cybersecurity market provided by Canalys, from 2017 to 2022. In 2017, Palo Alto had a 5.9% market share, behind Cisco (6.6%) and IBM (6.6%), but then had continuous share growth and took the first spot in 2022 with an 8.7% market share. Both Cisco and IBM continuously lost market share, ending with 5.4% and 3.1% respectively. Fortinet grew from 4.5% in 2017 to 6.2% in 2022 whereas Checkpoint lost market share, starting with 5.5% and ending with 3.3%.
Looking at the growth rates, Palo Alto has the highest 5-year average growth rate (25.4%) amongst the top 5 companies in terms of market share, with Fortinet (24.3%), Cisco (11.6%), Symantec (-6.0%) and Checkpoint (4.7%) following behind.
|
Cybersecurity Market Segments |
Segment Size ($ bln) (2022) |
Segment Size (2027F) |
CAGR |
|
Identity & Access Management |
14.7 |
27.9 |
13.7% |
|
Vulnerability & Security Analytics |
13.9 |
29.5 |
16.2% |
|
Data Security |
4.2 |
12.3 |
23.9% |
|
Web & Email Security |
3.9 |
7.2 |
12.8% |
|
Network Security |
22.9 |
42.3 |
13.0% |
|
Endpoint Security |
9.4 |
23.4 |
20.0% |
|
Integrated Risk Management |
10.9 |
21.2 |
14.3% |
|
Total |
80.0 |
163.8 |
15.4% |
Source: Canalys, Gartner, Market.Us, MarketsandMarkets (Security Analytics), MarketsandMarkets (Data Security), MMR, Fortune Business Insights, Radicati Group, MarketsandMarkets (Integrated Risk Management)
We derived our own cybersecurity market breakdown from Canalys and Gartner. We added the Integrated Risk Management segment that was in Gartner’s breakdown to the Canalys breakdown as it was absent in Canalys and it represented Palo Alto’s Threat Intelligence & Security Consulting segment. We obtained the segment size and CAGR for the cybersecurity segments from several research sites such as MarketsandMarkets, Fortune Business Insights, and Market.us. Of the seven cybersecurity market segments, we identified that Network Security is indeed the largest segment at $22.9 bln, followed by Identity & Access Management ($14.7 bln) and Vulnerability & Security Analytics ($13.9 bln). The highest-growing segments are Data Security (23.9%), Endpoint Security (20%), and Vulnerability & Secure Analytics (16.2%).
Palo Alto breaks down its cybersecurity services into four areas which are Network Security (includes Security Access Service Edge), Cloud Security, Security Operations, and Threat Intelligence & Security Consulting. When looking at the company’s annual report, investor presentations and company website, we see that the products from these four areas cover all seven cybersecurity market segments.
Although Palo Alto does not provide a revenue breakdown in terms of the four areas that it operates in, it stated within its 2021 analyst day presentation that the Network Security revenue for FY21 was $3.7 bln, which represented 87% of total revenue for FY21. Therefore, 87% of Palo Alto’s revenue comes from one market segment (Network Security), whereas the remaining 13% of revenue comes from the remaining six segments.
According to Forbes, the company’s key competitors are Fortinet and Checkpoint in the network security market segment. Also, Palo Alto and Fortinet lead network security with over 20% market share each. The three competitors mentioned are also a part of the top five companies by market share, which indicates network security is the biggest and most sought-after market segment by security vendors.
Although Network Security has the largest segment size, its CAGR is lower than that of the total CAGR. Despite the low segment growth, Palo Alto has still been able to gain significant market share with network security as it represents 87% of the company’s revenue which is impressive. Moreover, Palo Alto’s top two competitors, Fortinet and Cisco, offer products in the same areas as Palo Alto in terms of Network Security, Cloud Security, Security Operations, and Threat Intelligence & Security Consulting. Yet, Palo Alto’s impressive performance allowed it to gain market share and rise to become the market leader. In conclusion, Palo Alto has the highest market share in the cybersecurity market due to its dominance in network security and we further examine below whether the company has a competitive advantage over its competitors by analyzing both the hardware and software side of the business.
Security Hardware Market Leader
In this section, we analyze the hardware side of Palo Alto’s business. According to the annual report, the software side has a wide range of products, whereas hardware is made up of its physical Network Firewalls.
A Network Firewall is a security device used to prevent or limit illegal access to private networks by using policies defining the only traffic allowed on the network; any other traffic seeking to connect is blocked. – Palo Alto
In this segment, we look into the security hardware market and determine if Palo Alto has a competitive advantage in security hardware.
IDC, Khaveen Investments
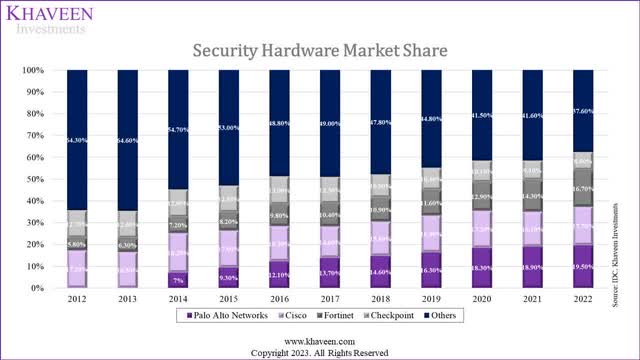
The chart above shows the security appliance market share until 2022. Palo Alto had a 7% share in 2014 but grew to become the market leader with a 19.5% share in 2022. On the other hand, Cisco’s share had been fairly stable with 17.7% in 2022. Another big gainer was Fortinet, which had a 5.8% share and climbed to a 16.7% market share. Checkpoint’s share declined from 12.7% to 8.5%.
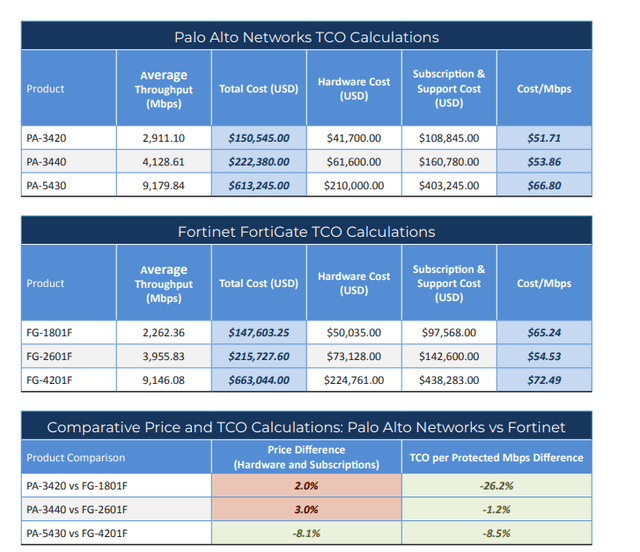
From the chart above, the biggest gainers were Palo Alto and Fortinet, with a minor difference of only between the two. Furthermore, we referred to a research report published by Miercom that compares Palo Alto and Fortinet firewall hardware to prove that Palo Alto is the superior player in the security hardware space. The test was run on three different network firewall products from each company and “business environments were simulated and challenged with real-world traffic scenarios to provide an accurate assessment of product performance”. The products chosen were to reflect what customers, in small businesses and data centers, can expect in terms of performance.
Miercom
Overall, the main purpose was to find the average throughput and TCO (total cost of ownership) per Mbps comparison for the three sets of products. Throughput refers to the “amount of data successfully transmitted over a connection”. TCO per protected Mbps refers to the cost-benefit value for each product which is derived by taking total cost divided by average throughput. Referring to the results, Palo Alto’s network firewall hardware is far superior compared to that of Fortinet’s as the average throughput is greater for all three Palo Alto products and the Cost per Mbps is lower for all three Palo Alto products.
In conclusion, Palo Alto has a significant competitive advantage over its competitors in the security hardware space as identified in its network firewall hardware performance comparison with Fortinet. Its competitive advantage is also reflected by its leadership position in the security hardware market (19.5% market share).
Network Security Software Market Leader
In this section, we analyze Palo Alto’s network security software and how it compares with competitors in this space. When looking at Palo Alto’s network security competition, we identified that Network Firewalls and Secure Access Service Edge (SASE) were common sub-segments among the companies.
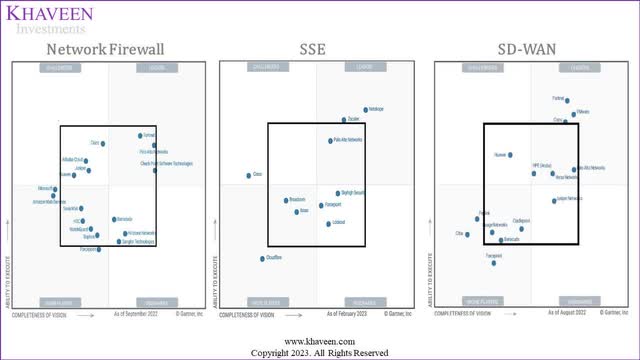
To compare performance, we looked into the latest Gartner Magic Quadrants for each of these products to see if Palo Alto has an advantage in the network security software space. Although we could not obtain a quadrant for SASE, we obtained the quadrants for SSE and SD-WAN which are subsets of SASE. According to Palo Alto, SSE “provides the security service elements of a comprehensive SASE (pronounced “sassy”) strategy”. Furthermore, Palo Alto stated that SD-WAN…
…enables organizations to securely connect users, applications, and data across multiple locations while providing improved performance, reliability, and scalability. – Palo Alto
It is especially useful for enterprises that have remote work. Based on its recent earnings, the company’s management highlighted its strength as the only company to be categorized as a leader in both SSE and SD-WAN by Gartner.
This in addition to our leadership position in SD-WAN, makes us the only SASE vendor in the industry to be named a leader in the Gartner SSE and SD-WAN Magic Quadrants. – Nikesh Arora, Chairman & CEO
In the chart below, the first quadrant to the left is the network firewall quadrant, the second one is the Security Service Edge quadrant and the third is the SD-WAN quadrant. It should also be noted that the network firewall quadrant includes hardware.
Gartner, Netskope, Palo Alto, Khaveen Investments
We compared a total of seven companies, with four being the biggest network security competitors (Palo Alto, Cisco, Fortinet, Checkpoint) and the remaining three being companies that appeared in more than one quadrant (Juniper, Barracuda, Forcepoint). To obtain a ranking for each of the seven companies we derived our own scoring system. The scoring system is as follows:
|
Rank |
Score |
Method |
|
1 |
100 |
Top right quadrant, beyond black square |
|
2 |
70 |
Top right quadrant, within black square |
|
3 |
50 |
Top left and bottom right quadrants |
|
4 |
30 |
Bottom left quadrant, within black square |
|
5 |
20 |
Bottom left quadrant, beyond black square |
|
0 |
10 |
Not within any quadrants |
Source: Khaveen Investments
Therefore, the closer the company is to a rank of one, the higher the score and the better its performance for that product. The total score for each company is as follows:
|
Company |
Network Firewall |
SSE |
SD-WAN |
Score |
|
Palo Alto |
2 |
2 |
2 |
210 |
|
Cisco |
3 |
3 |
1 |
200 |
|
Fortinet |
2 |
0 |
1 |
170 |
|
Juniper (JNPR) |
3 |
0 |
3 |
100 |
|
Forcepoint |
5 |
3 |
5 |
90 |
|
Barracuda |
3 |
0 |
4 |
80 |
|
Checkpoint |
2 |
0 |
0 |
70 |
Source: Gartner, Netskope, Palo Alto, Khaveen Investments
By looking at the quadrants, we believed that Palo Alto would be the market leader for network security software, the ranking system further supports our claim with Palo Alto having the highest total score (210) amongst the seven companies. However, Cisco has a total score of 200 which is extremely close to Palo Alto. The two axes for the Gartner magic quadrants are “the ability to execute” and “the completeness of vision”. Having the highest rank shows that overall, Palo Alto is the best for these two metrics.
Some of the ways Gartner measures a firm’s ability to execute is by its product capabilities, the financial success of the particular product, the vendor’s ability to adapt to market changes, customer experience, and the vendor’s ability to meet goals and commitments. Palo Alto’s ability to execute is reflected by looking at its customer base with 95% of Fortune 100 companies using its products and services. Its ability to adapt to market changes is reflected by the increase in major product releases over the past three years, with 22 (FY20), 29 (FY21),49 (FY22), and already 35 in the first half of FY23.
Additionally, Gartner measures a firm’s completeness of vision by its market understanding, marketing, and sales strategy. Palo Alto’s market understanding is reflected by 66% of customers using 3 or more of its network security services as of FY 21 There has also been a rapid rise in the number of accounts with a value of $1 mln and above, going from 542 in FY19 to 921 in FY21.
In conclusion, Palo Alto has a competitive advantage in network security software, albeit not significant due to Cisco’s high score from Gartner’s magic quadrants. Palo Alto’s competitive advantage is seen by having 95% of Fortune 100 companies as customers, increasing number of product releases, cross-selling products to customers and the increase in large value accounts.
Risk: Low Network Security Market Growth
Although Palo Alto has had rapid growth in market share over the past few years, it has mainly been driven by the network security segment (25.4% 5-year average). However, the expected market growth of 13% is the second lowest growth rate amongst the six cybersecurity market segments. Although Palo Alto has Security Operations (Endpoint Security) and cloud security (a mix of several cybersecurity market segments) which are high-growth segments expected to grow at 20% and 26.8% respectively, the revenue share of these segments needs to increase if Palo Alto is to maintain its competitive advantage in the long term. Having said that, Palo Alto is rapidly innovating in these segments which is seen when comparing its new product releases in FY21 compared to FY22. The product releases in the security operations segment increased from 9 to 18, the cloud security segment rose from 6 to 13 whereas network security had a minor increase from 14 to 18 new product releases. We believe this indicates that Palo Alto is starting to focus on higher growth segments.
Verdict
|
Palo Alto Valuation |
FY2024F |
|
Revenue ($ mln) |
8,842 |
|
P/S |
8.50x |
|
Equity Value ($ mln) |
75,159 |
|
Shares Outstanding (‘mln’) |
305.9 |
|
Price Target ($) |
245.74 |
|
Current Price ($) |
213.39 |
|
Upside |
15.16% |
Source: Palo Alto, Khaveen Investments
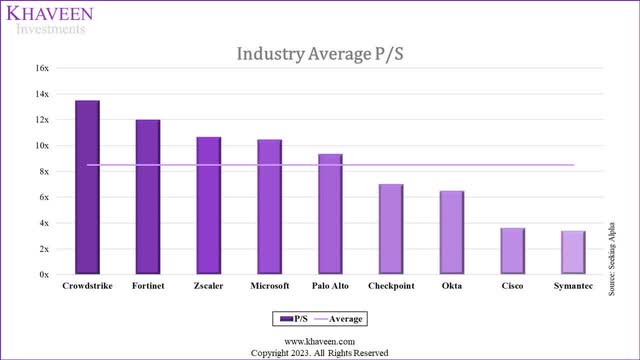
We forecasted Palo Alto’s revenues for FY2024 based on its past 6-year average growth rate for the product, subscription, and support segments and derived total revenues of $8.84 bln. We valued the company with a P/S valuation as we forecasted it to have a high growth rate above 20% for 2024. We based the average P/S ratio on nine cybersecurity companies which are 8.50x. The companies that were chosen are Symantec, Cisco, Okta, Checkpoint, Palo Alto, Microsoft, Zscaler, Fortinet, and CrowdStrike.
Seeking Alpha, Khaveen Investments
In our analysis, we observed that Palo Alto Networks experienced a remarkable increase in market share, positioning itself as the leading player in the cybersecurity market by the end of 2022. We attribute this success to the company’s competitive edge, particularly in the production of security hardware and software segments. Notably, we identified that Palo Alto’s network firewalls surpassed competitors, which we believe contributed to its dominance in security hardware. Additionally, Palo Alto stood out as the sole leader in various network security software sub-segments, where we determined that it boasted the highest overall score among its competitors in this segment, which accounts for 87% of its revenue in FY2021. These findings affirm our belief in Palo Alto’s competitive advantage over its rivals. Based on our P/S valuation, we assign a Buy rating to the company, with a target price of $245.70.
Read the full article here


