Investment Thesis
Lennar Corporation (NYSE:LEN) is a cyclical company. During the latest Housing Starts cycle from 2005 to 2022 (peak-to-peak), its revenue grew at 4.8 % CAGR. But this was due to a combination of 2.1% CAGR in Deliveries while unit selling price grew at 2.5% CAGR. Part of the growth was also due to the 2018 acquisition. Lennar is not a growth company in my opinion.
Over the past 70 years, there was no growth in the long-term annual average Housing Starts. However, there was growth in the Housing Price Index. But I would not consider the sector as a growth one.
I valued Lennar through a cyclical lens, assuming no growth in the long-term annual average Housing Starts. On such a basis, there was no margin of safety. The market is pricing Lennar as if there is a 1/3 increase in the long-term annual average Housing Starts. Alternatively, it appears the market is not considering Lennar as a cyclical stock.
Thrust of my analysis
Lennar is a cyclical company and as such any analysis and valuation should be based on its performance over the cycle.
In my Seeking Alpha article, “Home Builders’ Base Rates: A Reference For Better Fundamental Analysis”, (Bate Rate article) I assumed 2005 to 2022 as the peak-to-peak of the latest cycle.
Over the past 70 years, there was no growth in the long-term annual average US Housing Starts of around 1.5 million units.
But there are many articles on Seeking Alpha that seem to believe differently. Because of the pent-up demand and changes in the demographics, they think that there would be an increase in this long-term annual average Housing Starts.
I do not have a crystal ball to know which is correct. As such I valued Lennar based on two Scenarios:
- Scenario 1 – no change in the long-term annual Housing Starts of 1.5 million units.
- Scenario 2 – an increase in the long-term annual Housing Starts to 2.0 million units.
There is no margin of safety based on Scenario 1. The current market price of USD 112 per share (as of 2 June 2023) is around the value under Scenario 2.
Cyclical sector
The home building sector is cyclical. I had shown this in my Base Rate article.
The revenue of the sector is pegged to the US Housing Start. The US Housing Starts is cyclical with no growth in the average annual Housing Starts over the past 70 years.
Looking at Chart 1, I would draw the following conclusions:
- The past 2 years Housing Starts seem to be at the long-term annual average level.
- Over the past 70 years, there had been 4 occasions when the annual Housing Starts exceeded 2 million units.
- I am not sure whether the current drop in Housing Starts is merely a temporary pullback from an uptrend, or the start of the downtrend leg of the next cycle.
Chart 1: US Housing Starts (FRED)
While there is no growth in the annual average Housing Starts, there was long-term price growth. Refer to Chart 2.
In my Base Rate article, I had shown that the home building sector revenue growth for the past few years was the result of both volume growth as well as price growth. I will show that Lennar situation was similar.
Chart 2: US Housing Price Index (Trading Economics)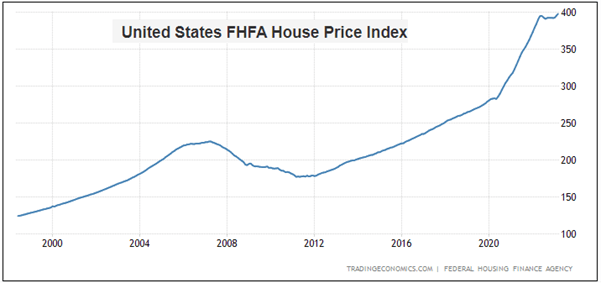
Valuation of cyclical companies
Damodaran has this to say about valuing cyclical companies:
“Cyclical and commodity companies share a common feature, insofar as their value is often more dependent on the movement of a macro variable… than it is on firm specific characteristics…the biggest problem we face in valuing companies…is that the earnings and cash flows reported in the most recent year are a function of where we are in the cycle, and extrapolating those numbers into the future can result in serious misvaluation.”
To overcome the cyclical issue, we have to normalize the performance over the cycle. Damodaran suggested 2 ways to do this:
- Take the average values over the cycle.
- Take the current revenue and determine the earnings by multiplying it with the normalized margins.
The challenge with the first approach for Lennar is that the size of the company currently is far greater than that in 2005. I thus adopted the second approach when looking at its value over the cycle.
To derive the normalized margins, I took to use the sum of the 2005 to 2022 values for the respective parameters.
For example, my normalized gross profit margins = sum of 2005 to 2022 gross profits divided by the sum of the 2005 to 2022 revenue.
Performance
I used 3 metrics to get an overview of the cyclical performance – revenue, profit after tax (PAT), and gross profitability (gross profits/total assets).
Chart 3 shows Lennar’s performance over the 2005 to 2022 cycle.
- During the trough part of the cycle, it incurred losses.
- The current gross profitability is about what it was in 2005. For most of the cycle, the gross profitability was below that in 2005. This is not a sign of a growth company.
- There is a 0.72 correlation between Lennar’s revenue and the Housing Starts over the cycle.
As illustrated in my Base Rate article, if you compared Lennar’s revenue from 2005 to 2016 with the Housing Start, we have a higher correlation at 0.92. This is because from 2016 to 2022 there was a significant increase in the selling prices. So revenue grew at a higher rate than Housing Starts affecting the correlation.
But if we looked a physical units, we have a 0.81 correlation between the US Housing Starts and Deliveries from 2005 to 2022.
Chart 3: Performance Index (Author)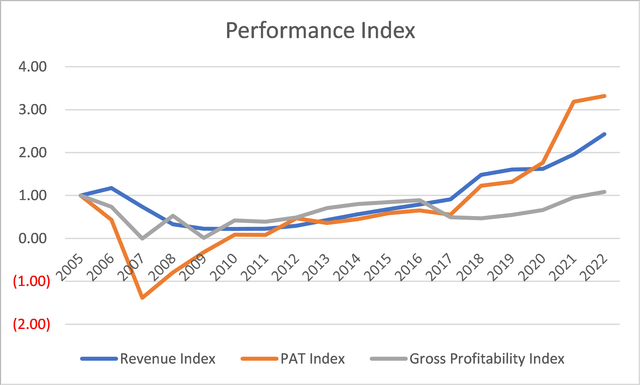
Notes to Chart 3: I converted the various metrics into indices to enable them to be plotted on the same chart. The index for a particular year is the value for the year divided by the respective 2005 value.
Over the past 18 years, revenue grew at about 4.8% CAGR. But this was due to a combination of volume growth and price growth as shown in Chart 4.
I estimated that during this period Deliveries grew at 2.1% CAGR while unit selling price grew at 2.5% CAGR. Are these signs of a growth company?
You can see that over the past 2 years, the high revenue growth was due to both growth in Deliveries and selling prices.
Chart 4: Breakdown of Revenue (Author)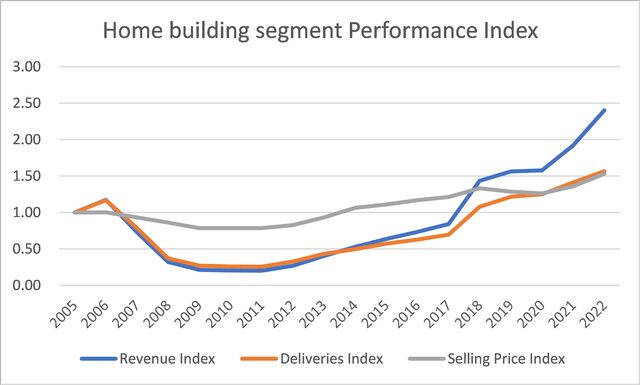
But Deliveries per se do not show the full picture. When I compared the annual Deliveries with the annual Housing Starts, I got a different picture.
In 2005/06, Lennar Deliveries were equal to about 3% of the Housing Starts. In 2021/22, they were equal to 4% of the Housing Starts. Lennar gained market share. But this was because of the 2018 CalAtlantic merger. This resulted in the 2018 revenue being 63% higher than that in 2017.
What does all this mean when valuing Lennar?
- Lennar is not a growth company.
- It is also operating in a no-growth (volume terms) cyclical sector.
Financial position
I would rate Lennar as financially strong based on the following:
- As of the end of Dec 2022, it has $4.7 billion in cash. This is about 12% of its total assets.
- It has a Debt Equity ratio of 0.16 at the end of 2022. In comparison, the mean Debt Equity ratio for the home builders as per my Base Rate article was 0.41 for 2022.
- Over the past 18 years, it generated an average of $836 million per year in Cash Flow from Operations compared to the average PAT of $1 billion per year. The average Cash Flow from Operations over the same period for the home builders as per my Base Rate article was $328 million. This put Lennar above the upper quartile position.
- It managed to generate positive Cash Flow from Operations for 13 out of the 18 years. Excluding Lennar, there were 8 home builders in my Base Rate panel companies. Of these, only 2 did better than Lennar on this measure.
I would like cyclical companies to be financially sound going into the downtrend leg of a cycle as I do not know how severe the downtrend will be. Lennar fits the bill.
Segment contribution
Lennar had 3 business segments – Home Building, Financial Services, and Others. However as shown in Chart 5, the main contributor is the Home Building segment.
Chart 5: Segment revenue (Author)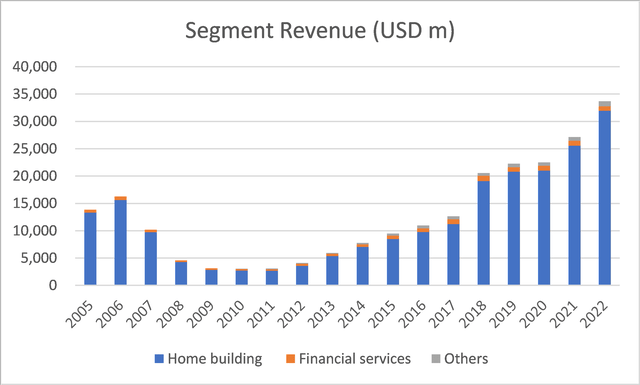
Nevertheless, in valuing Lennar, I modeled the 3 segments separately.
- I modeled the Home Building segment revenue based on the Deliveries and unit selling price.
- I tied the revenue of the Financial Services segment to the home building segment revenue. I used EXCEL to establish a regression equation for this as shown in Chart 6.
- The Others segment is relatively small as can be seen from Chart 6. I assumed the average past 3 years’ revenue as representative of the future.
Chart 6: Deriving the regression equation for the Financial Services segment (Author)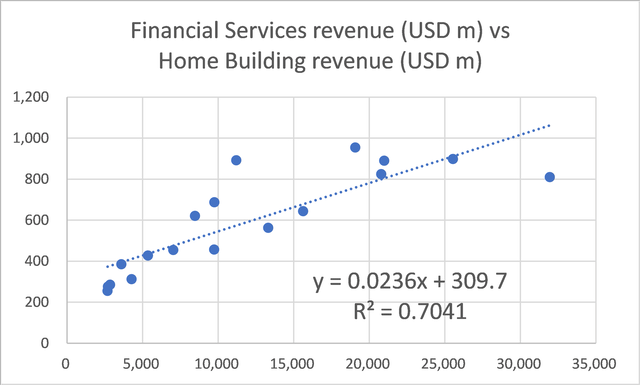
Valuation
I valued Lennar based on the single-stage Free Cash Flow to the Firm (FCFF) model.
I focused on 2 Scenarios:
- Scenario 1. I assumed that in 2021/22 we reached the long-term annual average Housing Starts of 1.5 million units.
- Scenario 2. This assumed that the long-term annual average Housing Starts was increased to 2.0 million units.
For both Scenarios, I assumed that growth was 4.7 %. This was 2005 to 2022 combined growth rate for the Deliveries and unit selling prices.
Table 1 summarized the results. You can see that there is no margin of safety under Scenario 1. The intrinsic value under Scenario 2 is just above the market price.
This means that the market is likely pricing Lennar as if there is going to be an upward shift in the long-term annual average Housing Starts. I have not seen any signs of this although there are many Seeking Alpha proponents of this.
Even if you believe in the increase in the long-term annual Housing Starts, I would argue that there is no margin of safety for this valuation scenario.
Table 1: Summary of Lennar valuation (Author)
Sensitivity analysis
Scenario 2 is an over-valuation of Lennar. It assumed instantaneous achievement of the Deliveries associated with the 2.0 million annual Housing Starts.
A more realistic picture is for some build up in the Housing Starts till it reached 2.0 million units.
According to Damodaran, if the “normal” cycle takes some time to come, we could take the following approach:
- Assume normalization in the long term.
- Allow the earnings to follow the current pattern in the short term and use the growth rate as the mechanism to bring it back to normalcy.
I used a 2 stage FCFF model to value Lennar on such a basis. I assumed that it would take another 5 years to reach the 2.0 million annual Housing Starts.
On such a basis I found that the intrinsic value was reduced to $105 per share. This supports my point that there is not enough margin of safety at the current market price.
On the other hand, if you assumed that Lennar is not a cyclical company, you would assume that the past 3 years’ margins represented the sustainable ones. Based on this and using the same valuation model, the intrinsic value of Lennar is $143 per share. But this is not a realistic picture as the evidence points to Lennar as a cyclical one.
Valuation model
I valued Lennar based on the single-stage Free Cash Flow to the Firm (FCFF) model:
Value of the operating assets of the firm = FCFF X (1 + g) / (WACC – g)
Where:
FCFF = EBIT X (1 – t) X (1 – Reinvestment rate)
EBIT = Gross profits – Selling, Admin, and Selling or SGA expenses – Asset write-downs
The gross profit is the sum of parts gross profits from the 3 segments – Home Building, Financial Services, and Others. This was derived as shown in Table 2.
Gross profits = Revenue X Gross Profit margins.
Table 2: Deriving the segment gross profits (Author)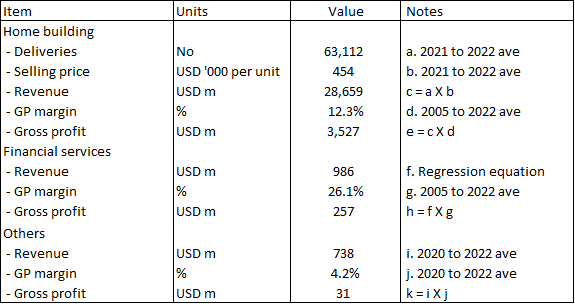
Notes to Table 2:
i) The Revenue for each segment was derived based on what was described earlier under the segment contribution section.
ii) I assumed the GP margins for the Home Building and Financial Services segments to be the average 2005 to 2022 values. For the Others segment, I assumed it to be the past 3 years’ average. As described earlier, to derive the normalized margins, I took to use the sum of the 2005 to 2022 values for the respective parameters. For example, my normalized GP margins = sum of 2005 to 2022 gross profits divided by the sum of the 2005 to 2022 revenue.
t = tax rate based on the past 3 years’ average annual tax rates.
g = 4.7 % based on the combined growth rates of Deliveries and unit selling prices.
Reinvestment rate = Reinvestment / EBIT(1 – t).
Reinvestment = CAPEX – Depreciation + Net Changes in Working Capital.
WACC = weighted average cost of capital derived from the first page of a Google search for the term “Lennar WACC” as summarized in Table 3.
Value of Equity = value of operating assets of the firm + Cash – Minority Interests – Debt.
Table 3: Estimating the WACC (Various)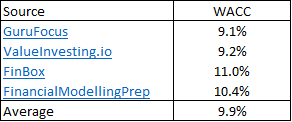
Sample calculation
Table 4 shows a sample calculation for the intrinsic value.
Table 4: Calculating the intrinsic value (Author)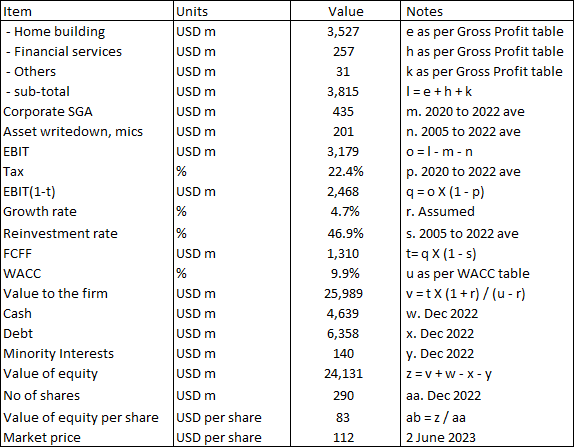
Notes to Table 4:
m) Lennar included the SGA for the Home Builders as part of the segment cost of sales. I have followed suit. This item “m” is for the SGA that is not allocated to the segments.
n) Over the past 18 years, Lennar incurred some asset write-downs and other one-off charges. I included the average value in my valuation.
s) The average Reinvestment rate was derived using the same approach as that for the various gross profit margins.
Risks and limitations
The crux of my valuation is that a large part of Lennar’s business is cyclical. I looked at the performance over the cycle rather than assumed that the current performance represented the future.
Having said that, you should consider the following when looking at my valuation:
- Non-cyclical WACC.
- Growth.
- Estimation of normalized values.
Part of the reason for the 9.9% WACC was because of the current high risk-free rate and equity risk premium. This is due to the uncertainty associated with the high inflation rates, possible recession, and the Ukraine invasion. If you are going to look at the value over the cycle, I would argue that you should also consider the risk-free rates and equity risk premiums over the cycle. Chart 7 shows what I mean.
Chart 7. Risk free rates and equity risk premiums (Author)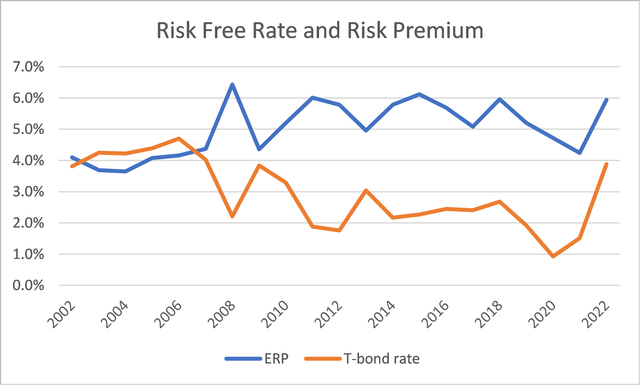
Notes to Chart 7. ERP refers to equity risk premium. I used the T-bond rate as the risk-free rate.
You can see that the cyclical risk-free rates and equity risk premiums would be lower than the current rates. This meant that my valuation is conservative.
In my valuation, I assumed a 4.7% growth rate. But I had shown that Lennar is not a growth company. Furthermore, if you accept that there is no long-term growth in the annual Housing Starts, you would conclude that this is a no-growth sector. Given these, it may be more appropriate to value Lennar based on its Earnings Power Value. The Earnings Power Value under both Scenarios is about half the values shown in Table 1.
In deriving the normalized values, I took the total numerator value divided by the total denominator value. Using this approach, the gross profit margins for the Home Building segment came to 12.3%. Another way to derive the normalized value is to take the average annual gross profit margins from 2002 to 2022. On such a basis, it came to 8.3%. If I had used 8.3%, I would have obtained a lower intrinsic value. You can see that using a different basis to estimate the normalized margins would have a significant impact on the valuation. My current approach gave a higher valuation than using the average annual margins.
Taking all the above into consideration, I would be worried if there is not at least a 30% margin of safety.
Conclusion
While I would rate Lennar as financially sound, I would not consider it a growth company. Given this and considering that it is a cyclical company, any analysis and valuation of Lennar should be based on its performance over the cycle.
I assumed that the cycle is represented by the 2005 to 2022 performance. This is pegging it to the latest peak-to-peak Housing Starts cycle.
My valuation of Lennar over the cycle showed that there is no margin of safety. The crux of my valuation is that there is no growth in the long-term annual Housing Starts.
The market is pricing Lennar as if there is going to be a 1/3 increase in the long-term annual Housing Starts. Alternatively, the market is not pricing Lennar as a cyclical one, but one whose past 3 years performance represented its future. I don’t think both of these are realistic.
I am a long-term fundamental investor holding onto stocks for 6 to 8 years. My analysis and valuation of Lennar is based on such a perspective. This is certainly not an analysis for the short-term fundamental investor seeking to gain from Lennar over the next 3 to 6 months.
Read the full article here


