Author’s note: This article was released to CEF/ETF Income Laboratory members on May 31, 2023. Please check latest data before investing.
The Weekly Closed-End Fund Roundup will be put out at the start of each week to summarize recent price movements in closed-end fund [CEF] sectors in the last week, as well as to highlight recently concluded or upcoming corporate actions on CEFs, such as tender offers. Data is taken from the close of Sunday May 28th, 2023.
Author
JPMorgan releases a nice Weekly Market Recap every week. These are the key index levels this week for equities:
JPMorgan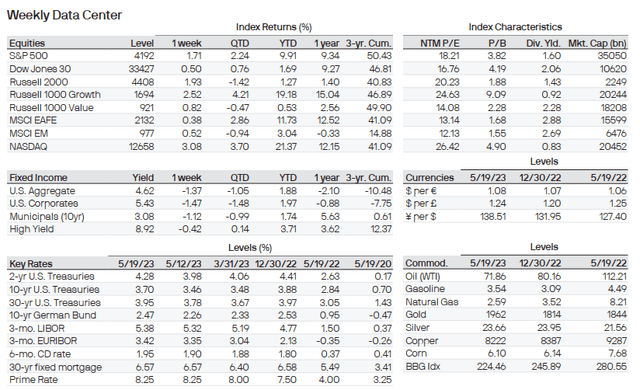
Weekly performance roundup
For CEFs, 1 out of 22 sectors were positive on price (down from 10 last week) and the average price return was -1.21% (down from -0.06% last week). The lead gainer was Asia Equity (+0.40%) while MLPs lagged (-3.34%).
Income Lab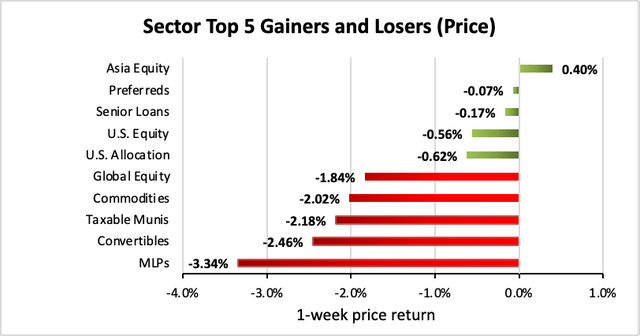
2 out of 22 sectors were positive on NAV (down from 9 last week), while the average NAV return was -0.83% (down from -0.06% last week). The top sector by NAV was Preferreds (+0.92%) while the weakest sector by NAV was MLPs (-2.70%).
Income Lab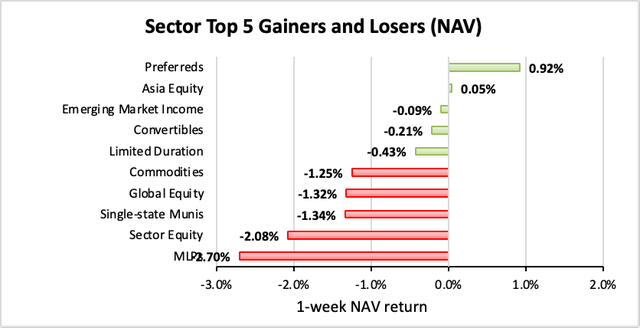
The sector with the highest premium was Commodities (-1.88%), while the sector with the widest discount is MLPs (-15.19%). The average sector discount is -8.94% (down from -8.50% last week).
Income Lab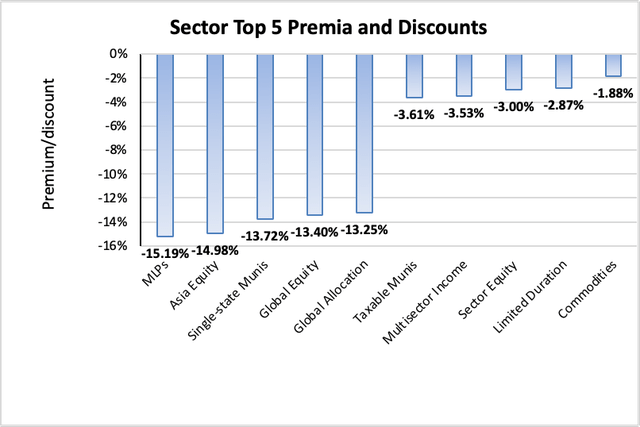
The sector with the highest premium/discount increase was Senior Equity (+0.60%), while Convertibles (-2.25%) showed the lowest premium/discount decline. The average change in premium/discount was -0.45% (down from +0.37% last week).
Income Lab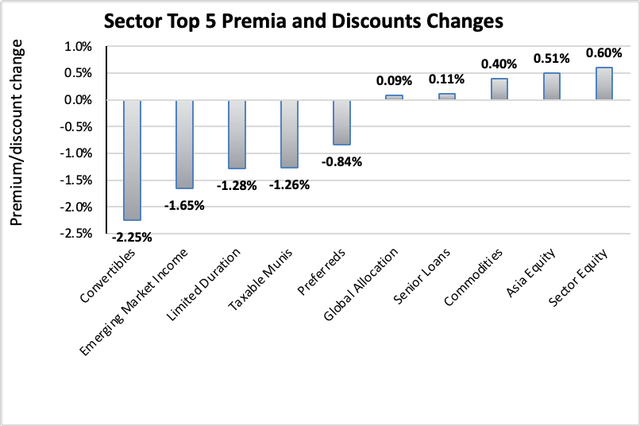
The sector with the highest average 1-year z-score is Commodities (+0.85), while the sector with the lowest average 1-year z-score is Real Estate (-1.56). The average z-score is -0.80 (down from -0.70 last week).
Income Lab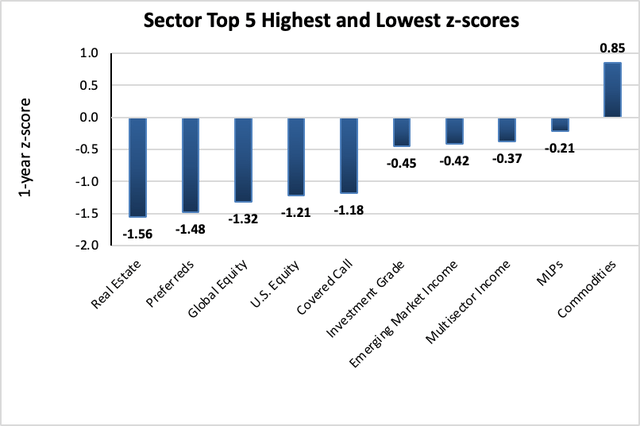
The sectors with the highest yields are Senior Loans (+12.60%), Emerging Market Income (+12.47%), and Real Estate (+11.20%). Discounts are included for comparison. The average sector yield is +8.47% (up from +8.38% last week).
Income Lab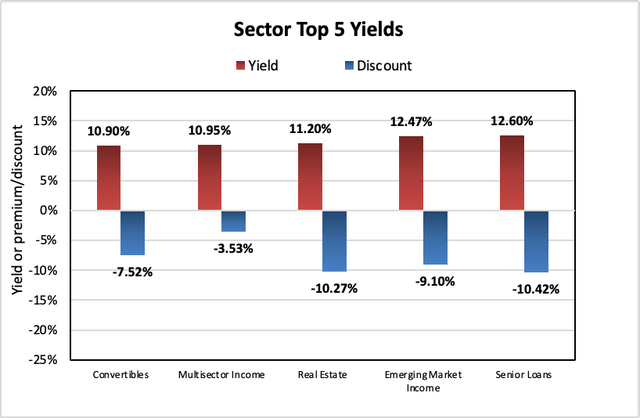
Individual CEFs that have undergone a significant decrease in premium/discount value over the past week, coupled optionally with an increasing NAV trend, a negative z-score, and/or are trading at a discount, are potential buy candidates.
| Fund | Ticker | P/D decrease | Yield | P/D | z-score | Price change | NAV change |
| PIMCO Strategic Income Fund | (RCS) | -9.41% | 12.41% | 15.19% | -0.2 | -6.98% | -2.46% |
| Virtus Stone Harbor Emg Mkts Total Inc | (EDI) | -8.75% | 18.46% | -3.19% | -0.8 | -6.76% | 2.44% |
| Neuberger Berman High Yield Strategies | (NHS) | -6.74% | 14.37% | -8.20% | -1.4 | -7.64% | 0.87% |
| Calamos Convertible Opp Inc | (CHI) | -5.58% | 11.47% | 1.53% | -1.3 | -5.60% | -0.45% |
| RiverNorth Opp Muni Income Fund Inc | (RMI) | -5.51% | 7.54% | -7.30% | -1.4 | -6.34% | -0.94% |
| Calamos Convertible & High Income Fund | (CHY) | -5.40% | 11.96% | -3.00% | -1.9 | -5.64% | 0.00% |
| Flah & Crum Preferred Securities | (FFC) | -3.74% | 7.81% | -8.43% | -1.7 | -3.47% | -1.88% |
| Putnam Managed Muni Income | (PMM) | -3.72% | 5.09% | -11.65% | -2.0 | -5.40% | -1.28% |
| JHancock Preferred Income | (HPI) | -3.60% | 10.43% | -1.86% | -1.8 | -2.27% | -0.36% |
| PCM Fund | (PCM) | -3.36% | 10.58% | 32.99% | 1.1 | -1.52% | 1.49% |
Income Lab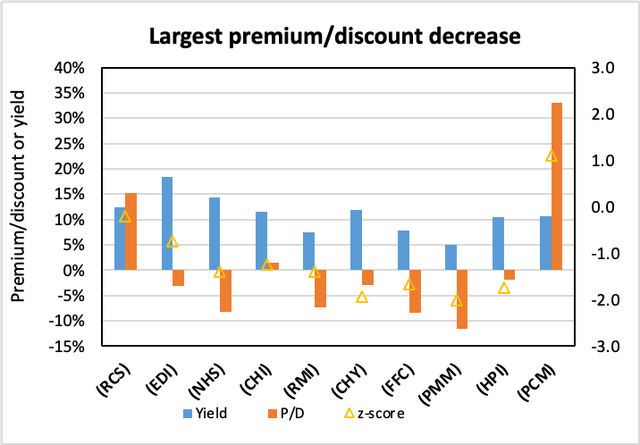
Conversely, individual CEFs that have undergone a significant increase in premium/discount value in the past week, coupled optionally with a decreasing NAV trend, a positive z-score, and/or are trading at a premium, are potential sell candidates.
| Fund | Ticker | P/D increase | Yield | P/D | z-score | Price change | NAV change |
| OFS Credit Company Inc | (OCCI) | 6.37% | 23.16% | -0.84% | 1.1 | 6.62% | -1.69% |
| Highland Floating Rate Opportunities Fd | (HFRO) | 4.52% | 10.11% | -31.69% | -0.6 | 6.28% | -3.84% |
| Barings Corporate Investors | (MCI) | 3.92% | 8.89% | -14.54% | 0.5 | 4.96% | -1.77% |
| RENN Fund ord | (RCG) | 3.71% | % | -16.74% | -1.3 | 5.14% | -1.04% |
| Western Asset Premier Bond | (WEA) | 3.37% | 7.67% | -5.67% | 0.9 | 1.28% | -3.81% |
| Japan Smaller Cap Fund | (JOF) | 3.03% | 0.63% | -13.26% | 2.0 | 0.14% | -1.26% |
| Highland Global Allocation Fund | (HGLB) | 3.01% | 11.53% | -20.98% | -0.2 | 2.10% | 0.00% |
| Virtus Total Return Fund Inc | (ZTR) | 2.67% | 15.92% | -8.50% | -0.5 | -0.33% | -0.27% |
| Duff & Phelps Utility and Infra Fund Inc | (DPG) | 2.57% | 11.62% | 9.55% | 0.3 | -1.63% | -0.92% |
| abrdn Global Income Fund, Inc. | (FCO) | 2.48% | 16.09% | 28.89% | 1.2 | 1.95% | -1.02% |
Income Lab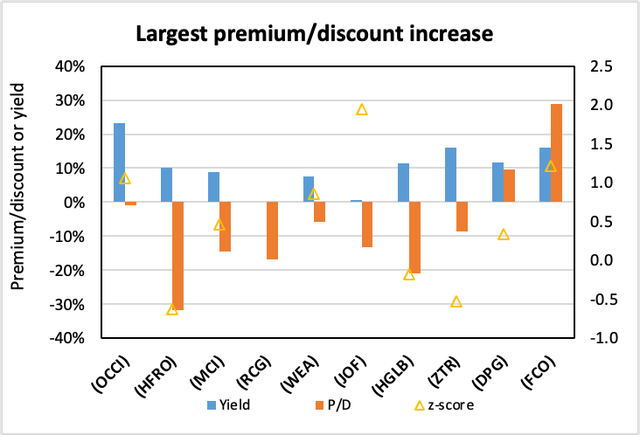
New!
From our screener, here are the CEFs with the highest yields, widest discounts, and lowest 1-year z-scores:
Income Lab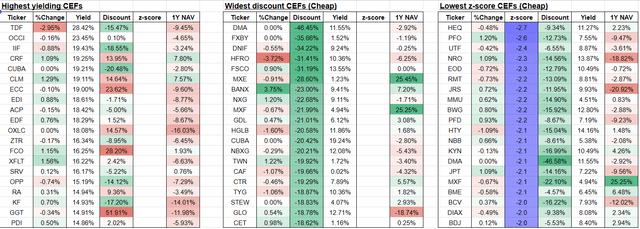
From our screener, here are the CEFs with the best 1-year performance, highest premiums, and highest 1-year z-scores:
Income Lab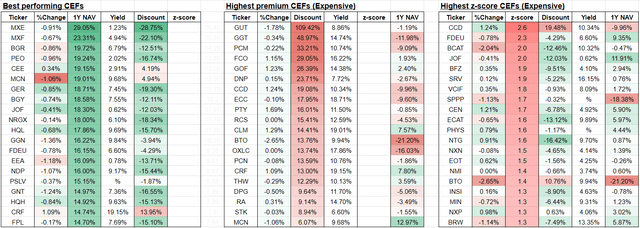
Recent corporate actions
These are from the past month. Any new news in the past week has a bolded date:
April 17, 2023 | Eaton Vance Closed-End Fund Merger Complete.
April 17, 2023 | Nuveen Municipal Closed-End Funds Announce Completion of Mergers.
Upcoming corporate actions
These are from the past month. Any new news in the past week has a bolded date:
May 11, 2023 | Neuberger Berman High Yield Strategies Fund Announces Rights Offering and Summary of Terms.
April 13, 2023 | Nuveen Preferred Closed-End Funds Announce Proposed Mergers.
March 30, 2023 | Center Coast Brookfield MLP & Energy Infrastructure Fund Announces Planned Reorganization.
March 27, 2023 | Kayne Anderson Energy Infrastructure Fund and Kayne Anderson NextGen Energy & Infrastructure Announce Proposed Merger.
March 22, 2023 | Board of First Trust Dynamic Europe Equity Income Fund Approves Conversion into an ETF.
Recent activist or other CEF news
These are from the past month. Any new news in the past week has a bolded date:
————————————
Distribution changes announced this month
These are sorted in ascending order of distribution change percentage. Funds with distribution changes announced this month are included. Any distribution declarations made this week are in bold. I’ve also added monthly/quarterly information as well as yield, coverage (after the boost/cut), discount and 1-year z-score information. I’ve separated the funds into two sub-categories, cutters and boosters.
Cutters
Income Lab
Boosters
Income Lab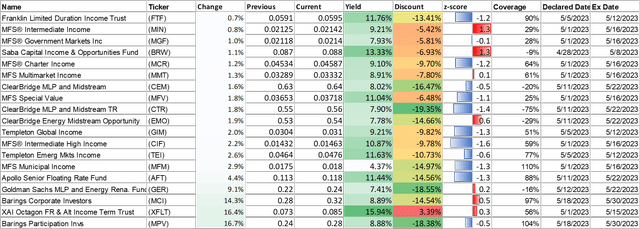
———————————–
Commentary
1. New Saba tracker
The activist hedge fund Saba Capital, led by Boaz Ronald Weinstein, are major players in the CEF space. They acquire large stakes in discounted CEFs, and push for board positions and shareholder-friendly actions such as tender offers, mergers with open-ended funds, or liquidations. These actions immediately unlock shareholder value because they allow investors to exit their position at NAV or close to NAV, which is generally normally something that can be done on demand for CEFs (unlike with ETFs or mutual funds).
I had found it tedious to manually look up Saba’s holdings in each fund individually, so I have created a “Saba tracker” to help our members keep track of the CEFs that Saba have sizable ownership stakes in. The tracker can be accessed from the Investing Resources bar on the main page of CEF/ETF Income Laboratory.
The sheet shows the top 50 CEFs by ownership percentage stake that Saba have a stake in. Statistics such as Saba’s nominal dollar size of the stake, and the fund discount, yield, z-score, and 1-year NAV performance are also included. There is also a column with a link to the 13D or 13G filed by Saba with the SEC for each fund. A 13D filing indicates active intent, or alternatively, is required when an investor accumulates over a 20% ownership stake in a fund. In contrast, the simpler 13G filing is required when an investor possesses at least a 5% ownership stake, and indicates passive intent.
For our public readers, this is a snapshot of Saba’s top 10 CEF positions (by percentage ownership).
Income Lab
This is a list of Saba’s top 10 CEF positions by dollar stake.
Income Lab
As we can see from the sheet, Saba have their fingers in many pies. Moreover, without insider knowledge, and it is impossible to predict the timing of when any concrete actions (e.g. tender offer, merger, liquidation) may take place. Nevertheless, the sheet may be still be useful for those considering piggybacking on Saba’s activist efforts. A combination of (1) a 13D filing (indicating active intent), (2) a large ownership % stake, (3) a wide discount, and (4) a large nominal dollar stake, may be the most worthwhile candidates to explore first.
Strategy Statement
Our goal at the CEF/ETF Income Laboratory is to provide consistent income with enhanced total returns. We achieve this by:
- (1) Identifying the most profitable CEF and ETF opportunities.
- (2) Avoiding mismanaged or overpriced funds that can sink your portfolio.
- (3) Employing our unique CEF rotation strategy to “double compound“ your income.
It’s the combination of these factors that has allowed our Income Generator portfolio to massively outperform our fund-of-CEFs benchmark ETF (YYY) whilst providing growing income, too (approx. 10% CAGR).
Income Lab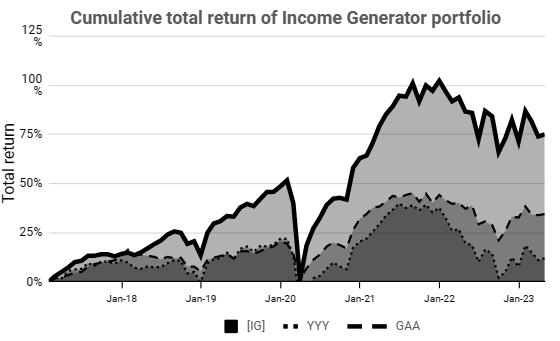
Remember, it’s really easy to put together a high-yielding CEF portfolio, but to do so profitably is another matter!
Read the full article here


