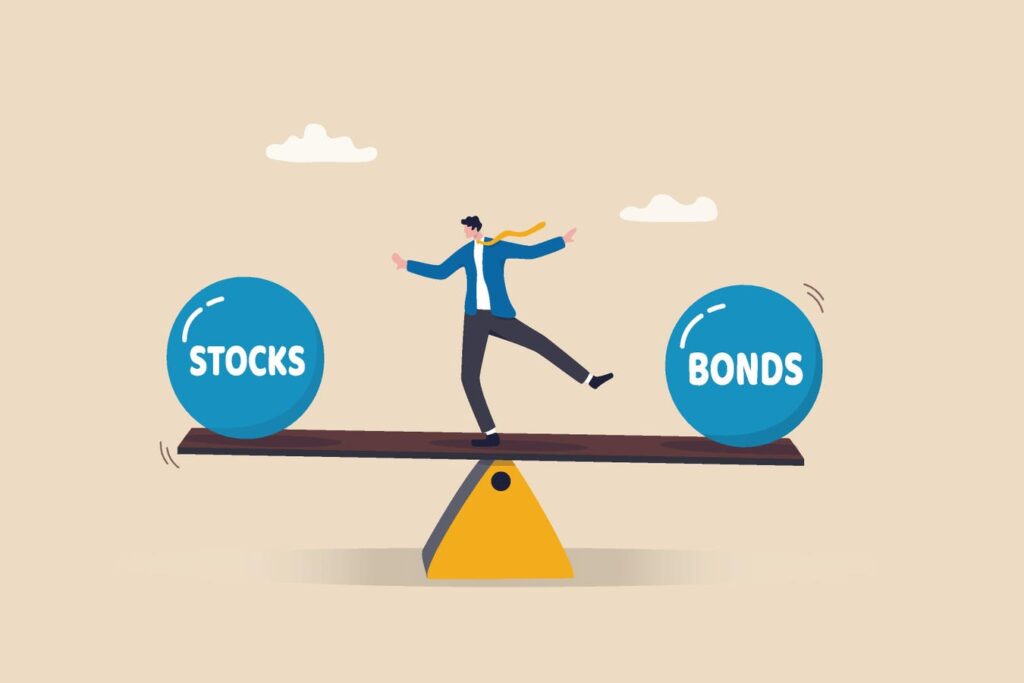
Hedging equity exposure with bond investments did not work out as hoped last year. The S&P 500 fell by 19.4% and instead of moving opposite it in response to a flight to safety, the ICE BofA U.S. Bond Market Index declined by 3.8%.
As a result of the bond bear market, however, the benchmark ten-year U.S. Treasury bond’s yield has more than tripled from 1.50% at the beginning of 2022 to 4.65% as of November 9, 2023. Some commentators now suggest that a classic 60/40 portfolio (representing the respective percentage weightings of the two categories) constitutes a good strategy going forward. Perhaps so, but there is no guarantee against being disappointed.
Historical experience can be a useful guide to managing one’s expectations about what any investment strategy can deliver. In the case of 60/40, it is instructive to consider how it performed the last time rates were around their current level. In each year from 2004 to 2008, the ten-year Treasury yield began the year in the 4.0% to 5.0% range. The chart below summarizes the performance of stock-only, bond-only, and 60/40 portfolios fared over the five-year period.
The 60/40 mix’s 1.84% average annual return for the period is materially better than the pure stock portfolio’s barely positive 0.03%, but hardly exciting in absolute terms. Similarly uninspiring is the $0.93 to which $1.00 invested at the beginning of the period in the 60/40 mix “grew” by the end of 2008. That was only slightly better than the $0.90 figure for stocks.
Fans of the 60/40 mix can certainly argue that the period depicted was unusual. The final year, 2008, represented the first 12 months of the Great Recession, the worst U.S. economic downturn since the Great Depression of the 1930s by various measures. Consequently, the average return for the five-year period reflects 2008’s horrendous -37.00% S&P 500 return. The table’s best advertisement for the 60/40 approach is its substantially less horrendous -20.38% return in that year.
Over the coming five years, a 60/40 mix may very well provide far greater benefits than in the five-year period in which interest rates were most similar to today’s. In addition, the strategy may wind up looking better ten years from now than just five years hence.
That possibility underscores a key point about assessing the suitability, for your particular needs, of a classically balanced portfolio: Much will depend on the term over which you count on the strategy to produce an acceptable tradeoff between maximizing return and limiting interim swings in the market value of your holdings.
Keep in mind as well that a 60/40 mix is no more a one-size-fits-all solution than any other approach to asset allocation. One school of thought holds that the right weighting of stocks and bonds depends on your age. The thinking is that you should reduce your equity percentage as you near retirement, to minimize the risk of retiring with too small a nest egg as the result of a big stock market decline just as you reach that point.
This lifecycle concept is commonly implemented by subtracting your age from 100 to calculate your appropriate percentage equity allocation. That is not the right answer for everybody, either. Suppose you are in the fortunate position of expecting to have sufficient retirement income without needing to shift more of your portfolio from stocks to bonds, which provide higher current income. In that case, the appropriate asset mix could be more a function of the ages of those who will inherit your assets.
In conclusion, a 60/40 portfolio may suit your needs and may work out quite well from here, in both the short and long term. These are tougher questions than they appear, however. The answers are subject to individual circumstances and the non-uniform behavior of stocks and bonds across time periods.
Make the most of today’s bond yields. Sign up to Forbes/Fridson Income Securities Investor.
Read the full article here


