The consensus outlook for 2024 looks rosy, at least when I am writing this just after Thanksgiving. November’s rally has been one of the best ever and the S&P500 (SP500) (NYSEARCA:SPY) is around 1% from its 2023 peak.
News flow is predictably positive. Yields may have finally topped and ‘higher for longer’ rates are no longer a threat. Indeed, inflation looks set to fall to the Fed’s 2% target sometime in Q2 which will mean rate cuts can come whenever they are needed.
The economy is slowing, as is necessary to tame inflation, but the risk of recession still looks low, particularly with unemployment at 3.9%. A soft landing is widely expected. Earnings for the S&P500 are expected to show double-digit growth.
Sentiment has certainly shifted since October when prices were dropping fast, as has the tone of the news flow. Here’s a comment from my October 2nd article when the S&P500 was at 3-month lows:
“Name one catalyst for higher equities today. Oh yeah…..hope.“
Admittedly, the situation did look dire back then, but this highlights how quickly things can turn around and how difficult it is to anticipate changes in news flow. This makes a yearly outlook quite a challenge. To make things even harder, the Seeking Alpha 2024 Market Prediction Competition requires a prediction of the price on a specific day, the 31st of December.
While I will do my best to make a prediction on this, I will focus more on upside and downside targets and a general expectation for the year as a whole. After all, I might be way off on the year-end prediction, but managed to call the exact top and bottom of the 2024 range, which I posit would be more valuable.
2024 Economy
After spending most of 2023 calling a recession, most analysts now expect a milder slowdown and ‘”soft landing.” I usually try to take the opposite side to consensus; if they were wrong in 2023, are they any more likely to be right now? After all, it seems optimism for a soft landing often precedes a turn for the worse.
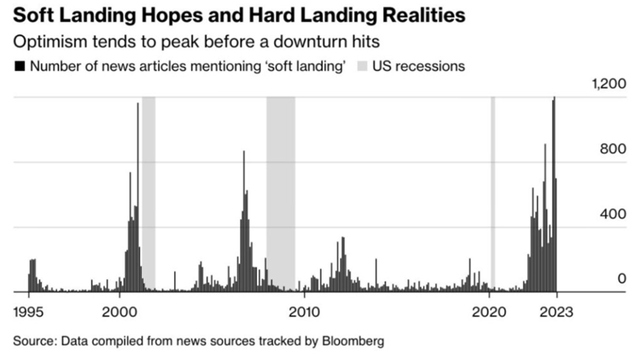
Soft Landing Expectations (Bloomberg)
I won’t make a deep dive into what could drive a recession. It looks likely to be related to tighter credit and liquidity issues, but could be government/Treasury induced or even a Black Swan. The real key is the unemployment rate which tends to rise into a recession and then accelerates rapidly.

US Unemployment Rate (FRED)
Quite simply, as long as the unemployment rate stays below 4.5% and claims are 250k or under, there is unlikely to be a deep recession.
But if unemployment reaches the acceleration phase, we can assume there will be a big problem which neither stocks – or the Fed – will not be able to ignore. A 20% drop in the S&P500 is the base case if a full recession unfolds.
I don’t think any contraction will be as severe as any of the last 3 recessions. The brief contraction of 1990 looks a more likely precedent and this led to a 20.7% drop the S&P500. There is also a neat parallel between the current tight Fed policy and consequent banking crisis and the Savings and Loan Crisis in the late 1980s and early 1990s.
Timing-wise, the S&P500 almost always bottoms during or slightly after a recession. In 1990, the bottom came during the contraction and new all-time highs were already made before the official end of it.
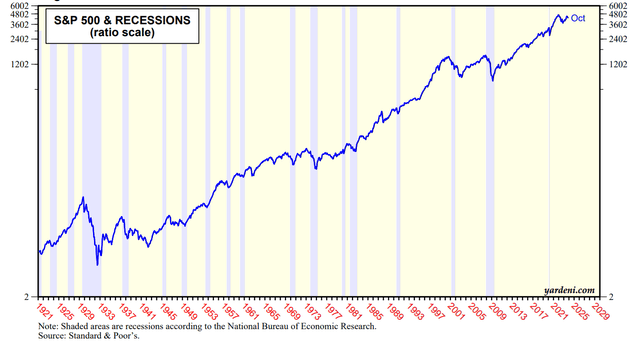
SPX and Recessions (Yardeni)
Fed Policy
While “higher for longer” is no longer expected (and was never likely in the first place), the yield curve is pricing a relatively neutral Fed policy based on a soft landing scenario. Around 100bps of cuts are expected over the course of the year and rates are expected to settle around 4% in 2025. The chart below shows how this compares with historical easing cycles.
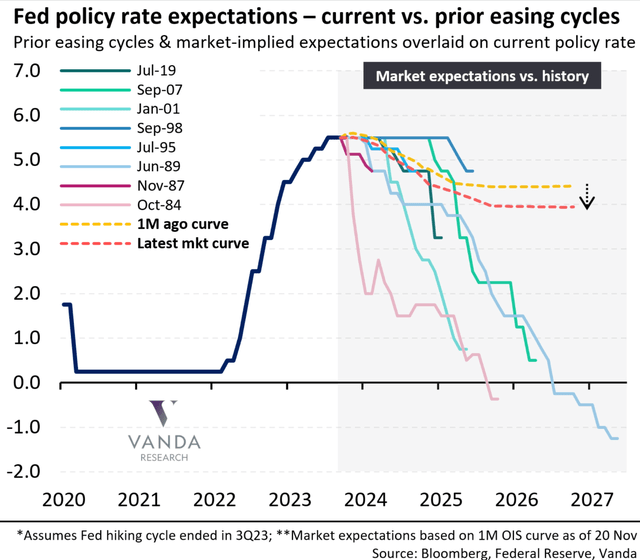
Rate expectations (Vanda)
Markets presume the Fed has got its policy just right and they can moderate policy slowly. However, this would be a rare occurrence. 1995-1998 is about the only proper easing cycle in the last 50 years where the cuts didn’t unwind most of the previous hikes and may have avoided a recession.
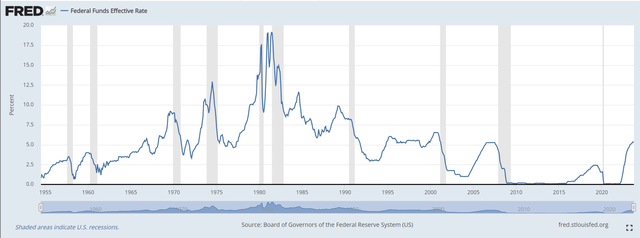
Fed Funds Rate (FRED)
History suggests rate cuts in response to economic weakness will likely come too late to be effective and lead to further cuts. The Fed Funds Rate could well end up near 2% and the 10Y yield around 2.5% following a standard 50% retrace of the 2020-2023 rally.
As for QT, it likely ends this year sometime after the first cuts. It is assumed the Fed would want the reverse repo balance near zero and bank reserves to fall before phasing out QT. This would mean it comes late in the year. However, should they be forced into a rapid easing cycle, it could end much earlier as they will want liquidity back in the system.
Earnings/Valuation
FY24 operating earnings of $242.54 are expected. Here is the official S&P spreadsheet from the 20th November –

S&P500 earnings (SP Global)
The figures have been revised lower since the start of October when $245 was expected, but still call for double-digit growth. Combining this with the likelihood of multiple expansion due to lower yields, the S&P500 could be valued a lot higher by the end of the year. A Forward PE multiple of 21 on $242.54 earnings would value the S&P500 at around 5093.
I actually like this target and do expect new all-time highs next year. However, I don’t buy the rosy consensus outlook or agree it will be achieved with steadily growing earnings.
As outlined in the previous sections, I expect a brief recession akin to 1990. This would likely shave off around 20% from the end-of-year figure so instead of the estimated 11.6% growth, there could be a contraction of around 8.4%.
During 1990 earnings fell 6.8% and they continued to drop in 1991. Yet, multiples expanded due to the aggressive easing cycle from the Fed. At the end of 1989, FY earnings were $23.52 with a PE of 14.53, while at the end of 1991, FY earnings were $19.30 with a PE of 21.61. This led to a sharp recovery in the S&P500 which soon regained the 20.7% drop. It went on to make new all-time highs within 9 months of the previous peak.
This could happen again. The S&P500 has, and always will, like lower yields. We may end up with a drop in earnings to $200, unemployment over 5% and the S&P500 at an all-time high with a PE of 25.
Technicals
My weekend articles use technical analysis to call the probable moves in the S&P500 in the week(s) ahead. While there is an element of prediction based on key levels, I also rely on reading price action and the market narrative. I won’t just mark an important level on the chart and buy there whatever the context.
Obviously, not all this can be done a year in advance, but given my view for another initial recession-led dip followed by a recovery, it is worth marking major levels on a higher timeframe chart in preparation for this move. Where will the market likely test under the expected conditions?
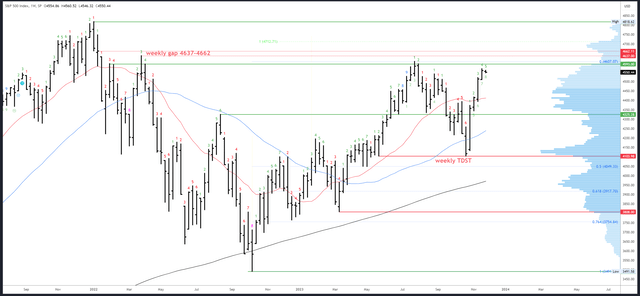
SPX Weekly (TradingView)
Readers of my weekend articles will recognize the weekly chart above. The levels such as the green line at 4593 and the red line at 4103 were all marked in advance of the reversals (see the weekly chart on my 22nd July article).
Under the recession scenario, I’d expect a 10-20% pullback and a break of the 4103 low. 4049 is my minimum expectation, but I doubt this holds and the major level of 3808 at the March low is a more compelling buy. 3794 is the 2023 low.
As for the upside, I’d expect 2024 to close near the highs of the yearly range. The eventual destination should be a break of 4818 to new all-time highs around 5000. Where it will be exactly on the close of the 31st December is less clear. I’ll take a guess and say 5093.
Bigger Picture
While I expect new all-time highs at some point, I do not expect a sustained new bull market. In fact, I think the 2009-2022 bull market is ending (or has already ended) and will correct with a long period of sideways action. Central banks, markets and society have changed significantly since 2020 and these changes need to be consolidated.
To visualize what this period could look like I use fractals or repeated price action. The theory behind this method is beyond the scope of this article, but the basic premise is that markets repeat patterns as traders repeat the same behaviours. While no two periods are exactly alike, traders’ emotions repeat and their actions are finite – buy, sell or do nothing – which can create similar patterns.
The fractal below is from my ebook on the subject and shows a possible path for the Dow Jones Industrial Average Index (DJI) over the coming years.
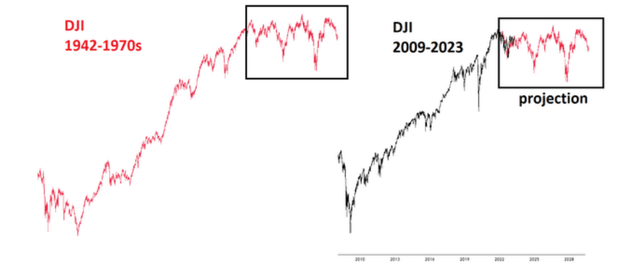
DJI Projection (Fractal Market Mastery)
There’s more to the above chart than just superimposing the 1970s consolidation at the end of the 2009-2022 bull market, but the background to it takes up a whole chapter of my book and I won’t repeat it here.
New highs don’t look justified and likely reverse for new lows in an expansion pattern likely to last many years. The Fed, meanwhile, will likely attempt to normalize its balance sheet and the US government could be forced to reduce its debt and deficits. I don’t think a sustainable uptrend can develop with the current unsustainable debt levels.
Risks to My View
My biggest concern is that I have the timing back-to-front. That is, the S&P500 could keep rallying to all-time highs in the first part of the year, then make a 20% decline into the second half. That would make my 5093 end-of-year prediction way off the mark, but there should be enough clues at various stages to adjust my trading strategy and I will continuously assess the situation in my weekend articles.
There is also the prospect of a sustained bear market, even a crash, and should 3794 break with a bearish pattern, I would have to make adjustments. However, I don’t think this is likely in an election year, especially when the Fed could make multiple rate cuts and end QT.
Conclusion
The consensus outlook for 2024 involves a soft landing, steadily growing earnings and a handful of rate cuts to ease away from restrictive rates. This should propel the S&P500 to new all-time highs.
I think this is optimistic and ignores the cumulative effects of 525bps in rate hikes, a banking crisis, a drain on liquidity and the huge Treasury deficit. Once unemployment rises, the economy could tip quickly into a recession and cause a large drop in the S&P500 to around 3808.
This will prompt the Fed into an aggressive easing cycle and I expect rates to fall to around 2%. The S&P500 could then recover into the election and end-of-year highs as multiple expansion drives a strong rally similar to 1990-1991. My prediction for the S&P500’s close on the 31st of December 2024 is 5093.
Editor’s Note: This article was submitted as part of Seeking Alpha’s 2024 Market Prediction competition, which runs through December 20. With cash prizes, this competition — open to all contributors — is one you don’t want to miss. If you are interested in becoming a contributor and taking part in the competition, click here to find out more and submit your article today!
Read the full article here
