Holiday season is underway and the S&P 500 (SPY) is approaching the 2023 high after the fourth best November performance ever. Meanwhile, the 10Y yield has broken back below the significant level of 4.32% (the 2022 high) and markets have discounted around 100bps of Fed cuts next year. Goldman Sachs pointed out “the month of November saw the largest easing in US financial conditions of any single month in the past four decades.”
Bullish as this all is, it is now in the rear mirror. This week’s article will investigate the next probable move and possible catalyst. Most importantly, it will outline specific conditions to either stay bullish, or to flip bearish. Various technical analysis techniques will be applied to multiple timeframes in a top-down process which also considers the major market drivers. The aim is to provide an actionable guide with directional bias, important levels, and expectations for future price action.
S&P 500 Monthly
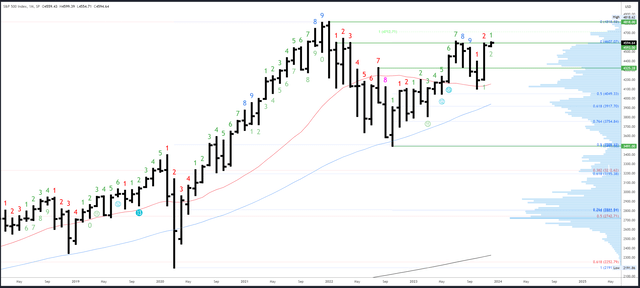
The November bar closed 8.9% higher and near the highs of the month. This gives an obvious positive bias which is already playing out with new highs in December.
Bullish bars typically test lower in the first part of the timeframe and close near the highs. Given the 2023 annual bar is typically bullish (but still inside the range of 2022), it would be usual to close near the high of 4607. A reversal could set up with new rejected highs above the November high of 4587, but the December bar would need to close near its low for this to develop into a solid signal.

SPX Monthly (Tradingview)
The key resistance area of 4593-4607 is being tested. The all-time high of 4818 is the next major level.
November’s high of 4587 will be important going forward as mentioned earlier. Initial support is 4541 at the September high, but this is minor. Real support comes in a lot lower at 4393 and 4325-35.
The September bar completed a Demark upside exhaustion count. This has had its effect and there will be a long wait for the next monthly signal. December will be bar 3 (of a possible 9) in a new downside exhaustion count.
S&P 500 Weekly
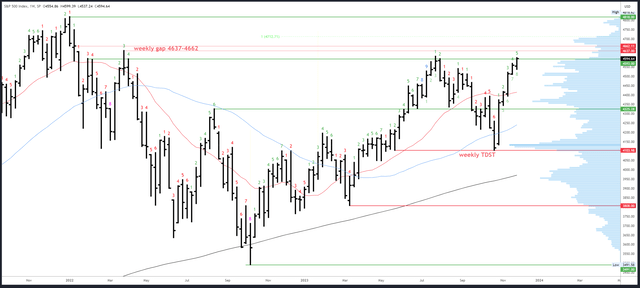
Yet another continuation bar formed this week. A strong close near the highs projects some follow through above 4599 next week, with the 4607 peak the logical destination.
4607 is obviously a significant level but is not an inflection point. If 4608 trades, it does not necessarily signal a trip to 4818 and the all-time high. In other words, a reversal can develop whether or not 4607 holds.

SPX Weekly (Tradingview)
The weekly gap at 4637-4662 is the next area of interest above 4607. 4712 is a measured move (where the current rally is equal to the October-December ’22 initial rally).
This week’s 4537 low is key support.
An upside Demark exhaustion count will be on bar 6 (of a possible 9) next week. This suggests the count can continue into the end of December before a reaction is seen.
S&P 500 Daily
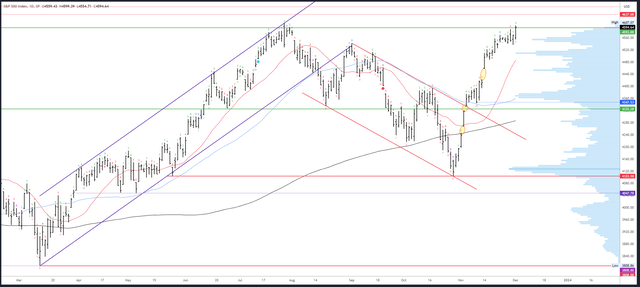
The November rally was so strong, dips are barely visible on the weekly chart and a daily view is needed to see the important details. Even still, only two “proper” corrections can be identified in the rally – last week’s dip to 4537, and the drop to 4343 on 9th November which lasted just one session.
A strong rally does not mean much in terms of future returns. The bear market rallies of March 2022 and July-August 2022 were similar in size and duration. Perhaps a better comparison comes from October-November 2021 as the S&P500 was then in an uptrend and gained 9% in just 17 sessions. It then chopped around during December and rallied into a January peak.
I’m not necessarily saying this will happen again, but I will use technical markers to signal when it gets more or less likely.

SPX Daily (Tradingview)
Resistance points all come from the monthly/weekly charts.
On the other hand, support levels mostly come from the daily chart. As mentioned earlier, the 4537 low is important. The 20dma could also be in play as it is currently at 4485 and rising 14 points a day. 4487 is the next key level as the area below is “thin” (low volume) and a break could quickly lead to 4421.
The last Demark exhaustion signal completed on 22nd November and led to a pause but no real dip. The next count will be on bar 3 (or a possible 9) on Monday which means no reaction is expected next week.
Drivers / Events Next Week
The market has rapidly priced in rate cuts and Fed Chair Powell’s push back against this on Friday was pretty tame. No one really believes rate hikes are still on the table. Saying that, at this moment rate cuts are not that likely either given the S&P500’s performance, the aforementioned record easing in financial conditions and the robust economy. This theory could be put to the test next week as Friday is NFP day. Strong numbers would challenge rate cut expectations and could cause a dip in the S&P500.
Good news could therefore be bad. But will bad news be good? Not necessarily: while weak jobs numbers would support the expectation for cuts, they could also dent the “soft landing” narrative. The labour market is key for the economy so overly weak numbers and another rise in the unemployment rate could put recession fears back in focus.
In short, the jobs report has to come in very close to expectations to support this rally and the bar is set high for a sustained positive reaction.
The ISM Services PMI is due out on Tuesday but is only likely to cause short-term volatility.
Markets will have one eye on next week when CPI, the FOMC meeting and retail sales are all due. There are also rate meetings from the ECB, BoE and SNB on Thursday.
Probable Moves Next Week(s)
The S&P500 chart is bullish in all timeframes (apart from the yearly chart which is neutral and trading an inside bar). It is worth noting the 2023 peak of 4607 is close and the rally has moved a long way in a short space of time, but that is more a reason to lighten up longs into strength ahead of NFP rather than a reason to get bearish.
Given the strong close this week, continuation to test 4607 looks probable and this likely breaks to test the weekly gap at 4637. With so much critical news due late next week and the following week, the rally should then fade and a enter a consolidation. Dropping back through 4607 would invite a test of 4537 which likely acts as a floor for a bull flag into Christmas to set up a further rally to 4712, perhaps even 4818 early next year.
A weak close below 4537 would be the first signal of weakness. Closing below 4487 would cement a decisive reversal. That’s too far away to be ideal, but this is often the dilemma – take more risk and speculate, or forego much of the reward and wait for confirmation. Personally, I will be a buyer near 4537 if the conditions unfold as expected, and a seller should this level break convincingly.
Read the full article here


