Earnings of BOK Financial Corporation (NASDAQ:BOKF) will likely decline this year because of pressure on the margin and growth of non-interest expenses. On the other hand, loan growth will likely support earnings. Overall, I’m expecting the company to report earnings of $7.42 per share for 2024, down 8% year-over-year. The year-end target price suggests a small upside from the current market price. Based on the total expected return, I’m maintaining a hold rating on BOK Financial.
Margin’s Decline Likely to Slow Down
BOK Financial’s net interest margin plunged by a cumulative 90 basis points in 2023, which was far worse than I expected. The poor performance was partly attributable to a sharp deterioration of the deposit mix. Non-interest-bearing deposits dropped to 27% of total deposits by the end of December 2023 from 39% at the end of December 2022. This deposit migration was attributable to the up-rate cycle as every rate hike increased the incentive for depositors to shift their funds away from non-interest-bearing accounts and chase yields.
I believe the up-rate cycle of the last two years has ended and the Federal Reserve will most probably reduce its fed funds rate this year. Therefore, I think the deposit mix deterioration witnessed last year will not recur this year. As a result, the pressure on the margin from deposit migration will likely be missing this year.
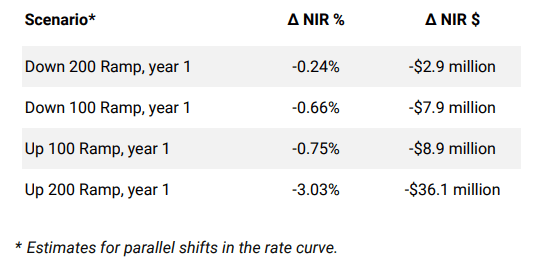
However, the margin could face some pressure because of the anticipated rate cuts. As mentioned in the earnings presentation, approximately 74% of the total loan portfolio is variable rate or fixed rate that reprice within a year; therefore, the average loan yield can be expected to trend downwards in 2024. Further, the results of the management’s rate-sensitivity analysis given in the presentation show that a 100 basis points dip in interest rates could slightly reduce the net interest income.

4Q 2023 Earnings Presentation
Considering these factors, I’m expecting the margin to dip by eight basis points in 2024.
Loan Growth Likely to Remain Healthy
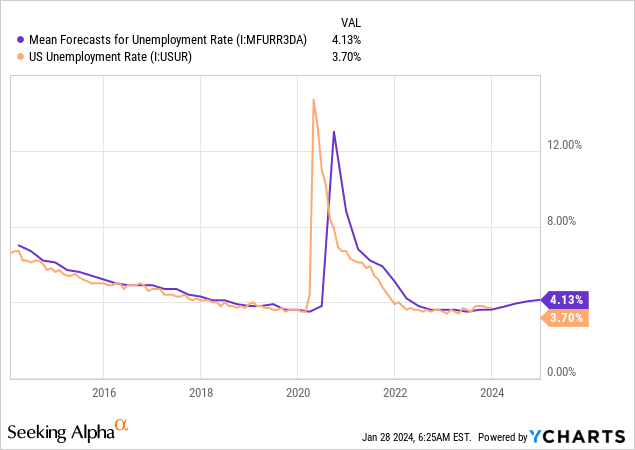
Loan growth during 2024 remained in line with my previous expectations. The loan portfolio grew by 0.8% in the last quarter of 2023 leading to full-year growth of 5.9%. Going forward, I think growth can remain at least last year’s level because the economic outlook continues to remain positive. BOK Financial operates in several states across the Midwest and Southwest; therefore, I’m considering the national economic metrics as a proxy for BOKF’s many local markets. Professional forecasters expect the country’s unemployment rate to remain quite low compared to previous years, as shown below. Further, the Fed anticipates the unemployment rate to increase to 4.1% in 2024.

Moreover, the management’s guidance points towards good loan growth for 2024. The management mentioned in the conference call that the current loan pipeline is strong. Further, the management expects continued strong momentum to drive additional loan growth in 2024. The management also mentioned in the presentation that it expects mid-to-upper-single-digit annualized loan growth.
Considering these factors, I’m expecting the loan portfolio to grow by 6.1% in 2024. The following table shows my balance sheet estimates.
| Financial Position | FY19 | FY20 | FY21 | FY22 | FY23 | FY24E |
| Net Loans | 21,540 | 22,619 | 19,949 | 22,321 | 23,628 | 25,078 |
| Growth of Net Loans | 0.4% | 5.0% | (11.8)% | 11.9% | 5.9% | 6.1% |
| Other Earning Assets | 15,451 | 18,924 | 24,950 | 19,601 | 20,626 | 20,626 |
| Deposits | 27,621 | 36,144 | 41,242 | 34,481 | 34,020 | 35,401 |
| Borrowings and Sub-Debt | 8,621 | 3,821 | 2,494 | 7,138 | 8,955 | 9,319 |
| Common equity | 4,856 | 5,266 | 5,364 | 4,683 | 5,142 | 5,485 |
| Book Value Per Share ($) | 68.2 | 75.8 | 78.2 | 69.7 | 78.3 | 83.5 |
| Tangible BVPS ($) | 51.7 | 59.1 | 61.6 | 53.0 | 61.5 | 66.7 |
| Source: SEC Filings, Author’s Estimates(In USD million unless otherwise specified) | ||||||
Non-Interest Expenses to Keep Earnings Low
Non-interest expenses shot up in the last quarter of 2023 because of FDIC assessment expenses totaling $44 million. This assessment expense will not recur in 2024, which will ease some pressure on operating expenses. Excluding the FDIC special assessment, the management expects expenses to increase at a mid-single-digit growth rate as it plans to continue to invest in strategic growth and technology initiatives. Further, the management expects revenue growth to follow expense growth at a slight lag. As revenue growth is realized in 2024, the management expects the efficiency ratio to migrate downward to a range of approximately 65%.
The management’s target is not too ambitious as the company has averaged an efficiency ratio of 62.5% in the last five years, and 66.2% in the five years before the pandemic. Nevertheless, I think the efficiency ratio will likely be worse than the management’s guidance due to my inflation outlook. I’m expecting inflation to be around 2.5% in 2024, which is higher than the average five-year rate of 1.8% before the pandemic (2015-2019). The Fed projects an inflation rate of 2.4% for this year, which is also higher than the average before the pandemic. Overall, I’m expecting an average efficiency ratio of 67% for 2024.
Both non-interest expense growth and net interest margin contraction will likely pressurize earnings this year. On the other hand, decent loan growth will likely support the bottom line. Overall, I’m expecting earnings of $7.42 per share for 2024, down 8% year-over-year. The following table shows my income statement estimates.
| Income Statement | FY19 | FY20 | FY21 | FY22 | FY23 | FY24E |
| Net interest income | 1,113 | 1,108 | 1,118 | 1,211 | 1,272 | 1,197 |
| Provision for loan losses | 44 | 223 | (100) | 30 | 46 | 32 |
| Non-interest income | 694 | 844 | 756 | 643 | 790 | 830 |
| Non-interest expense | 1,132 | 1,166 | 1,178 | 1,164 | 1,333 | 1,363 |
| Net income – Common Sh. | 501 | 432 | 614 | 516 | 527 | 487 |
| EPS – Diluted ($) | 7.03 | 6.19 | 8.95 | 7.68 | 8.02 | 7.42 |
| Source: SEC Filings, Author’s Estimates(In USD million unless otherwise specified) | ||||||
Risks Appear to be Manageable
I’m not worried about BOK Financial’s risks because of the following reasons.
- Commercial Real Estate segment’s office exposure was less than 4% of total loan balances at the end of 2023, as mentioned in the presentation.
- Uninsured deposit balances excluding collateralized and consolidated subsidiary balances were $12.9 billion at the end of 2023, representing a hefty 38% of the total deposit book. Nevertheless, these uninsured deposits are not worrisome because BOKF has more than enough liquidity to cover these deposits. As mentioned in the presentation, BOKF’s coverage ratio stood at ~ 179% at the end of 2023.
- As of December 31, 2023, the available-for-sale securities portfolio had a net unrealized loss of $617 million, which is just 12% of the total equity book value.
Maintaining a Hold Rating
BOK Financial is offering a dividend yield of 2.6% at the current quarterly dividend rate of $0.55 per share. The earnings and dividend estimates suggest a payout ratio of 30% for 2024, which is close to the five-year average of 28%. Therefore, the negative earnings outlook does not threaten the dividend payout.
I’m using the historical price-to-tangible book (“P/TB”) and price-to-earnings (“P/E”) multiples to value BOK Financial. The stock has traded at an average P/TB ratio of 1.44 in the past, as shown below.
| FY19 | FY20 | FY21 | FY22 | FY23 | Average | |
| T. Book Value per Share ($) | 52.1 | 59.1 | 61.6 | 53.0 | 61.5 | |
| Average Market Price ($) | 81.2 | 60.2 | 90.6 | 93.8 | 85.0 | |
| Historical P/TB | 1.56x | 1.02x | 1.47x | 1.77x | 1.38x | 1.44x |
| Source: Company Financials, Yahoo Finance, Author’s Estimates | ||||||
Multiplying the average P/TB multiple with the forecast tangible book value per share of $66.7 gives a target price of $96.1 for the end of 2024. This price target implies a 12.4% upside from the January 26 closing price. The following table shows the sensitivity of the target price to the P/TB ratio.
| P/TB Multiple | 1.24x | 1.34x | 1.44x | 1.54x | 1.64x |
| TBVPS – Dec 2024 ($) | 66.7 | 66.7 | 66.7 | 66.7 | 66.7 |
| Target Price ($) | 82.8 | 89.4 | 96.1 | 102.8 | 109.5 |
| Market Price ($) | 85.5 | 85.5 | 85.5 | 85.5 | 85.5 |
| Upside/(Downside) | (3.2)% | 4.6% | 12.4% | 20.2% | 28.0% |
| Source: Author’s Estimates |
The stock has traded at an average P/E ratio of around 10.8x in the past, as shown below.
| FY19 | FY20 | FY21 | FY22 | FY23 | Average | |
| Earnings per Share ($) | 7.03 | 6.19 | 8.95 | 7.68 | 8.02 | |
| Average Market Price ($) | 81.2 | 60.2 | 90.6 | 93.8 | 85.0 | |
| Historical P/E | 11.5x | 9.7x | 10.1x | 12.2x | 10.6x | 10.8x |
| Source: Company Financials, Yahoo Finance, Author’s Estimates | ||||||
Multiplying the average P/E multiple with the forecast earnings per share of $7.42 gives a target price of $80.4 for the end of 2024. This price target implies a 5.9% downside from the January 26 closing price. The following table shows the sensitivity of the target price to the P/E ratio.
| P/E Multiple | 8.8x | 9.8x | 10.8x | 11.8x | 12.8x |
| EPS 2024 ($) | 7.42 | 7.42 | 7.42 | 7.42 | 7.42 |
| Target Price ($) | 65.6 | 73.0 | 80.4 | 87.8 | 95.3 |
| Market Price ($) | 85.5 | 85.5 | 85.5 | 85.5 | 85.5 |
| Upside/(Downside) | (23.3)% | (14.6)% | (5.9)% | 2.7% | 11.4% |
| Source: Author’s Estimates |
Equally weighting the target prices from the two valuation methods gives a combined target price of $88.3, which implies a 3.2% upside from the current market price. Adding the forward dividend yield gives a total expected return of 5.8%.
In my last report, which was issued in April 2023, I determined a target price of $93.9 for the end of December 2023 and adopted a hold rating. I’ve now rolled over the target price to December 2024. As the updated total expected return is still lackluster, I’ve decided to maintain the hold rating on BOK Financial.
Read the full article here


