FNDC strategy
Schwab Fundamental International Small Equity ETF (NYSEARCA:FNDC) started investing operations on 08/15/2013 and tracks the RAFI Fundamental High Liquidity Developed ex US Small Index. As of writing, it has 2017 holdings (including cash in various currencies), a 30-day SEC yield of 2.32% and a total expense ratio of 0.39%. Distributions are paid semi-annually.
FNDC implements the RAFI methodology in an ex-US developed markets small cap universe. As described in the prospectus by Schwab Asset Management, the underlying index starts from the RAFI Global Equity Investable Universe, where companies get a score based on adjusted sales, retained operating cash flow, and dividends plus buybacks. Then, they are grouped in order of decreasing score and each company receives a weight based on its percentage of the total scores of the developed ex U.S. companies within the parent universe. The bottom 12.5% of the companies by cumulative fundamental score are included in the index. The index is reconstituted quarterly in four segments, resulting in an annual complete reconstitution. The portfolio turnover rate was 22% in the most recent fiscal year. This article will use as a benchmark iShares MSCI EAFE Small-Cap ETF (SCZ).
Portfolio
The portfolio is overweight in Japan, with 36.9% of asset value. Other countries are below 10%. FNDC has some positions in South Korea and Canada, which are ignored by SCZ. The next chart lists the top 10 countries, representing 83% of assets. Hong Kong weighs 2.5%, so direct exposure to geopolitical risks related to China is low.
FNDC top 10 countries (chart: author, data: Schwab, iShares)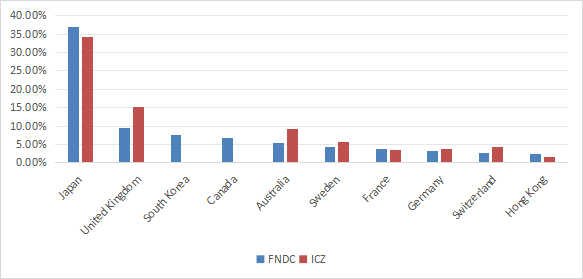
The heaviest sectors are industrials (22%), consumer discretionary (14.2%) financials (11.7%) and materials (11.4%). Other sectors are below 8%. Compared to SCZ, FNDC mostly underweights technology and real estate, but the two funds are very close regarding the sector breakdown.
Sector breakdown (chart: author, data: Schwab, iShares)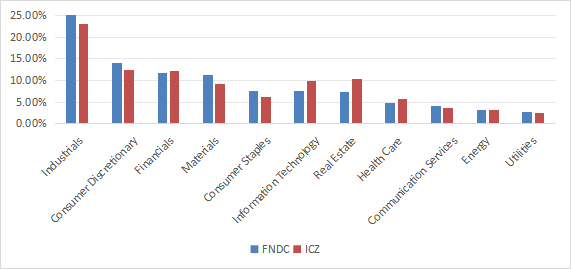
FNDC is quite close to SCZ regarding valuation ratios and aggregate growth rates. Earnings growth is significantly lower, though.
|
FNDC |
SCZ |
|
|
Price / Earnings TTM |
13.23 |
12.47 |
|
Price / Book |
1.09 |
1.26 |
|
Price / Sales |
0.61 |
0.7 |
|
Price / Cash Flow |
5.75 |
5.98 |
|
Earnings Growth |
14.06% |
19.35% |
|
Sales Growth |
4.34% |
4.89% |
|
Cash Flow Growth |
4.57% |
5.08% |
(data source: Fidelity)
FNDC’s top holding is a U.S. money market fund (GVMXX), with a weight of 0.8%. The top 10 companies in the portfolio, listed in the next table, represent 2.3% of asset value, and the heaviest one weighs 0.41%. Therefore, the fund is very diversified and risks related to individual companies are extremely low.
|
Name |
Country |
Local Symbol |
Weight% |
Sector |
|
DSM FIRMENICH AG |
CH |
DSFIR |
0.41 |
Materials |
|
CELESTICA INC |
CA |
CLS |
0.29 |
Information Technology |
|
HOKKAIDO ELECTRIC POWER |
JP |
9509 |
0.24 |
Utilities |
|
NOVOZYMES CLASS B |
DK |
NSIS B |
0.23 |
Materials |
|
ROLLS-ROYCE HOLDINGS PLC |
GB |
RR. |
0.23 |
Industrials |
|
HD KOREA SHIPBUILDING & OFFSHORE E |
KR |
9540 |
0.21 |
Industrials |
|
ASICS CORP |
JP |
7936 |
0.18 |
Consumer Discretionary |
|
CONCORDIA FINANCIAL GROUP LTD |
JP |
7186 |
0.17 |
Financials |
|
AMOREPACIFIC CORP |
KR |
90430 |
0.17 |
Consumer Staples |
|
TOHO HOLDINGS LTD |
JP |
8129 |
0.17 |
Health Care |
Performance
From its inception in August 2013, FNDC is 2.3% behind the ex-U.S. small cap benchmark (SCZ) in total return. The gap measured in annualized return is insignificant. Both funds are lagging the U.S. small cap index Russell 2000 (IWM).
FNDC vs SCZ, IWM since 8/19/2013 (Seeking Alpha)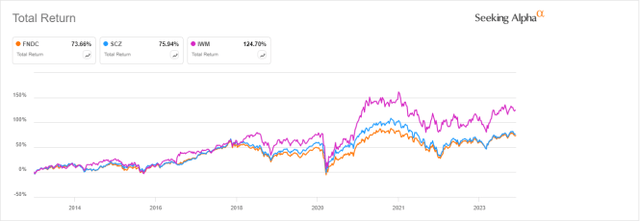
Over the last 12 months, FNDC is marginally ahead of SCZ, and behind IWM again.
FNDC vs SCZ, IWM since 8/19/2013 (Seeking Alpha)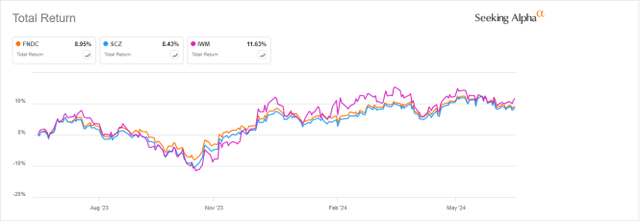
Competitors
The next table compares characteristics of FNDC and four factor-based international small-cap ETFs:
- Avantis International Small Cap Value ETF (AVDV)
- iShares International Small-Cap Equity Factor ETF (ISCF)
- Invesco FTSE RAFI Developed Markets ex-U.S. Small-Mid ETF (PDN)
- First Trust Developed Markets ex-US Small Cap AlphaDEX Fund (FDTS)
|
FNDC |
AVDV |
ISCF |
PDN |
FDTS |
|
|
Inception |
8/15/2013 |
9/24/2019 |
4/28/2015 |
9/27/2007 |
2/15/2012 |
|
Expense Ratio |
0.39% |
0.36% |
0.23% |
0.49% |
0.80% |
|
AUM |
$3.32B |
$5.93B |
$532.81M |
$490.80M |
$8.25M |
|
Avg Daily Volume |
$4.97M |
$20.98M |
$1.43M |
$539.73K |
$11.89K |
|
Holdings |
2013 |
1357 |
1035 |
1518 |
414 |
|
Top 10 |
2.71% |
8.02% |
5.44% |
2.49% |
6.03% |
|
Turnover |
22.00% |
14.00% |
3.79% |
31.00% |
124.00% |
|
Yield TTM |
2.93% |
3.19% |
4.03% |
2.97% |
2.95% |
FNDC is the second largest, and second most liquid fund in this group. The next chart plots total returns, starting on 9/30/2019 to match all inception dates. FNDC is second to last, far behind the leader AVDV.
FNDC vs. Competitors since 9/30/2019 (Seeking Alpha)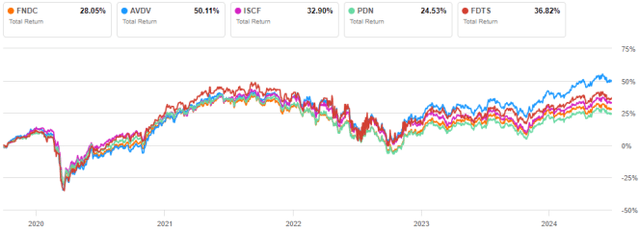
It is the worst performer over the last 12 months, tie with PDN:
FNDC vs. Competitors since inception (Seeking Alpha)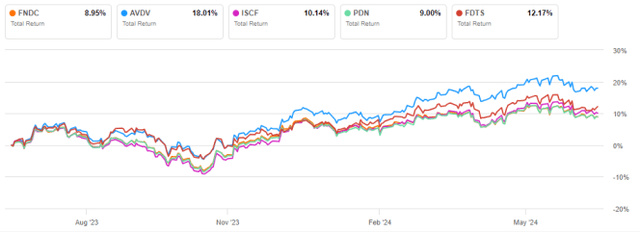
Takeaway
Schwab Fundamental International Small Equity ETF implements the RAFI methodology in a small cap universe of ex-US developed markets. It is overweight in Japan and heavy in industrials, but well-diversified across a large number of companies. The sector breakdown, fundamental metrics and return since inception of FNDC are not much different from a benchmark in the same universe. Over the last few years, FNDC has lagged a number of factor-based ETFs in this universe, making it quite unattractive compared to them, especially to Avantis International Small Cap Value ETF.
Read the full article here


