JPMorgan Equity Premium Income ETF (JEPI) is very popular with retirees and investors seeking generous monthly income. I wrote about it here:
I’m a big fan of JEPI. I consider it a gold standard covered call ETF due to its unique approach to generating relatively higher, more stable income in an ETF designed for 85% of the market’s upside with about 65% of the downside.
Since writing that article, I have had several requests to analyze the JPMorgan Nasdaq Equity Premium Income ETF (NASDAQ:JEPQ).
This ETF takes a similar approach to JEPI, but uses the Nasdaq as its base, which has advantages and disadvantages compared to JEPI.
Allow me to share the three facts I’ve learned that are important for anyone considering buying this 9% yielding monthly paying ETF to know.
These three facts will explain why JEPQ is perfect for two kinds of investors.
- DRIP investors in a Roth IRA
- are taxable investors who understand that it’s a high-yield retirement fund, not a “high-yield Nasdaq ETF.”
Fact 1: Perfect Structure For Maximum Income
Remember how JEPI works.
JPMorgan 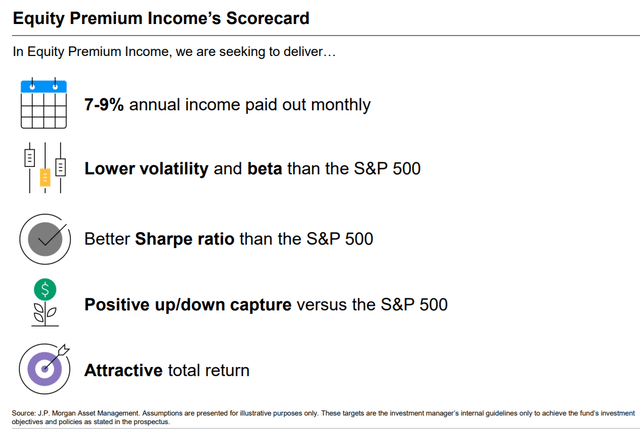
It’s designed for 8% long-term monthly income with lower volatility than the S&P, and it accomplishes this using exchange-traded notes, or ELNs.
JPMorgan 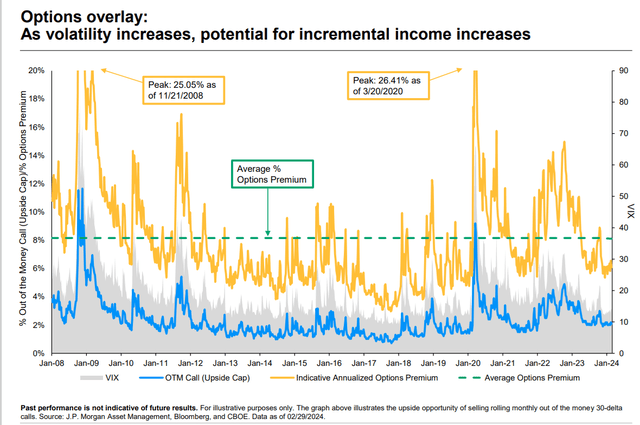
The key to JEPI and JEPQ is volatility. ELNs are similar to covered calls in that they harvest the volatility risk premium.
ELNs are debt instruments issued by large banks like Citigroup that allow JPMorgan to invest in a basket of relatively low-volatility stocks that yield little on their own but generate significant income.
JPMorgan 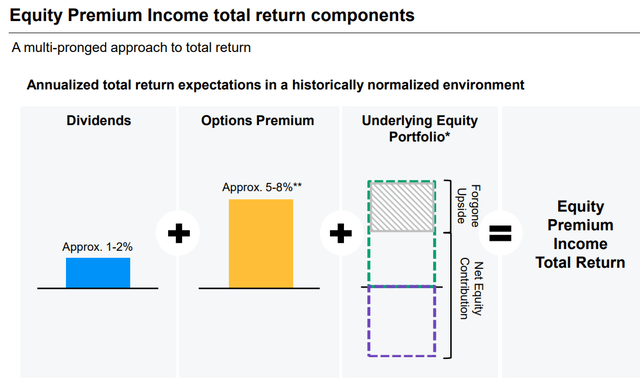
So what about JEPQ? It’s the same strategy, except that instead of an actively managed 100-stock blue-chip portfolio, JEPQ takes the Nasdaq 100 (NDX) and writes ELNs against it.
JPMorgan 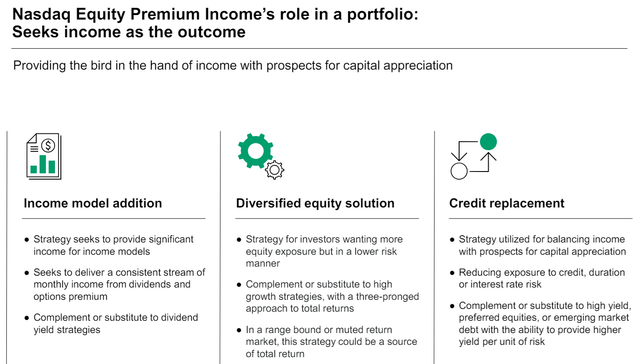
JEPQ converts the Nasdaq into a pure income strategy by harnessing the highest inherent volatility of the Nasdaq.
JPMorgan 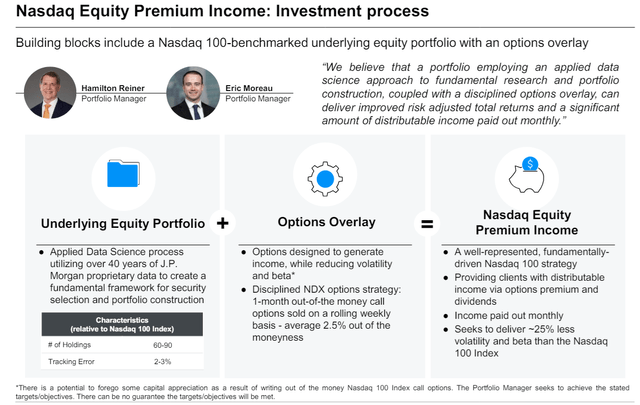
2.5% out of the money means that JPMorgan Asset Management is taking the Nasdaq and using an ELN strategy that maximizes its benefits if it doesn’t go up more than 2.5% per month.
Another way to think of it is that, on average, JEPQ, on a pre-tax basis, captures 85% of the Nasdaq’s gains up to 34% per year in gains.
At least, that’s how it’s designed—25% less volatility than the Nasdaq and up to 85% of the Nasdaq’s upside.
JPMorgan 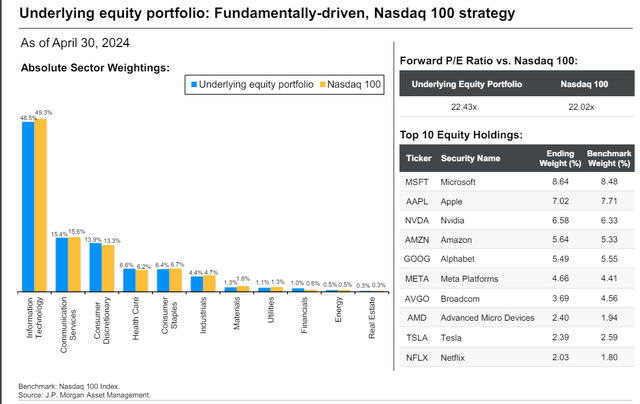
While the Nasdaq 100 is far from perfect, mainly because it ignores excellent NYSE companies like UnitedHealth (UNH) and Mastercard (MA), it does represent some truly outstanding wide moat ultra sleep well at night (“SWAN”) blue chips.
JPMorgan 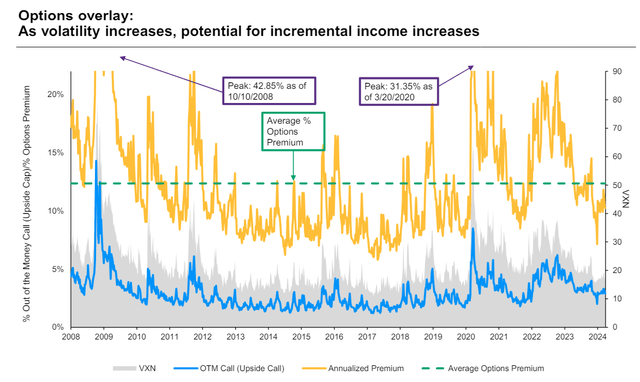
While JEPI’s lower volatility design (which targets 65% of the S&P’s downside) means lower income, JEPQ is writing ELNs on higher volatility stocks. The average premium on this strategy since 2008 has been 12%, with a peak yield of almost 43% in the Great Recession.
Note that this doesn’t mean that JEPQ, had it existed in 2008, would have generated gains of 43%. Merely, it would have briefly been paying a 43% yield, though the Nasdaq was down almost 60%.
So, it is not designed to rise in bear markets and provide a lower-volatility, higher-yield monthly income strategy.
JPMorgan 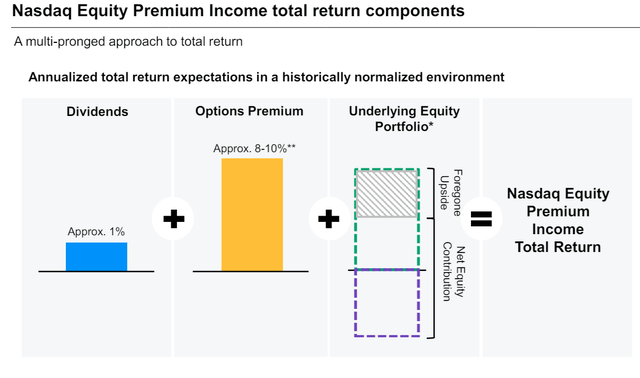
Long-term management is guiding for 9% to 11% long-term returns on JEPQ with about 90% to 100% of the S&P’s volatility (75% of the Nasdaq’s volatility).
Fact 2: The Volatility Benefits Of JEPI Are Somewhat Muted
Remember what made JEPI famous: its 8% monthly yield and much lower volatility in the 2022 bear market.
Portfolio Visualizer Premium 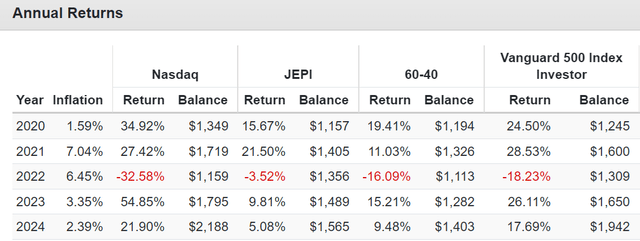
It fell under 4% in 2022 when the 60-40 and S&P fell significantly, and the Nasdaq lost a third of its value.
However, that’s partially because JEPI is not the S&P with ELNs generating income, but rather a low volatility blue-chip portfolio actively managed by JPMorgan to be a low volatility stock base for 85% of the portfolio.
The Nasdaq is not a low-volatility portfolio, so the options yield on ELNs is about 2% higher over time.
JEPI & JEPQ Since June 2022
| Metric | S&P | Nasdaq | JEPI | JEPQ |
| Yield | 1.2% | 0.5% | 7.4% | 8.8% |
| Historical Return (June 2022) | 16.5% | 25.7% | 7.7% | 18.6% |
| Consensus Future Return/Management Guidance | 13.2% | 15.7% | 8.0% | 10% |
| Beta | 1.00 | 1.14 | 0.57 | 0.83 |
| S&P Upside Capture | 100 | 134.94 | 48.34 | 93.56 |
| S&P Downside Capture | 100 | 110.35 | 58.54 | 83.11 |
| S&P Upside/Downside Capture Ratio | 1.00 | 1.22 | 0.83 | 1.13 |
| Conditional Value At Risk | 8.74% | 9.77% | 5.00% | 7.55% |
| Sortino Ratio | 1.10 | 1.60 | 0.51 | 1.38 |
| Treynor Ratio | 12.57 | 18.53 | 6.40 | 16.84 |
(Source: Portfolio Visualizer Premium.)
Since its inception, JEPQ has captured 83% of the S&P’s downside and 75% of the Nasdaq’s downside.
Remember, JEPQ is built to capture 75% of the Nasdaq’s downside, so it’s been doing its job very well.
Thanks to the incredible rally of big tech, the Mag 7 especially, since inception, JEPQ’s historical returns of 19% are very impressive.
Since JEPQ Inception (June 2022)
(Source: Portfolio Visualizer Premium)
They are certainly better than JEPI’s 7.7% annual return.
In essence, JEPI might, at first glance, look like a superior alternative to the S&P itself.
9% yield, impressive returns, lower volatility, and downsides no worse than the S&P. What’s not to love?
Fact 3: The Downside Of JEPQ All Potential Investors Need To Know
JPMorgan 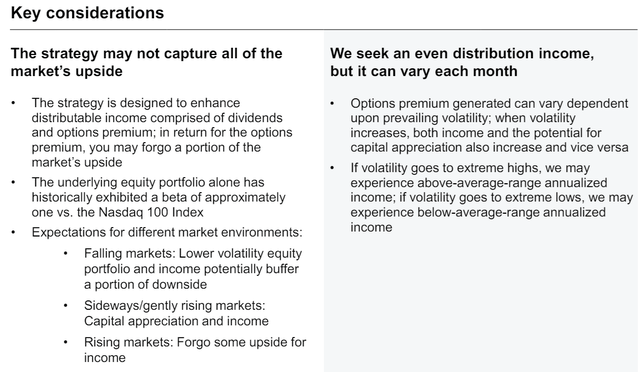
As JEPQ points out, the monthly income is variable, based on option premiums generated by its ELN portfolio.
Ycharts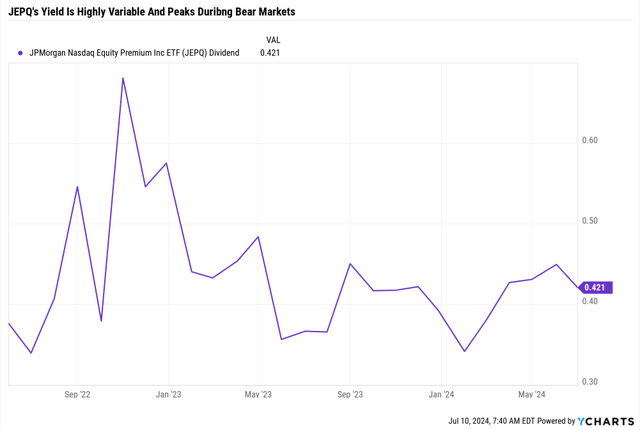
Here are the monthly dividends for JEPQ. You can see how yield was maximum in late 2022 at the market’s bottom when the Nasdaq hit -35% from record highs.
Ycharts (Source: Portfolio Visualizer Premium)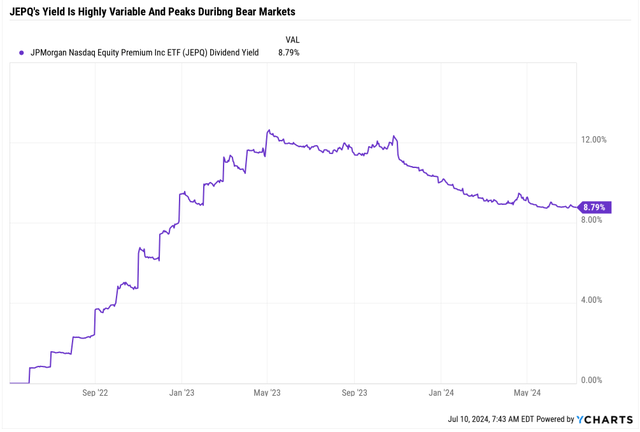
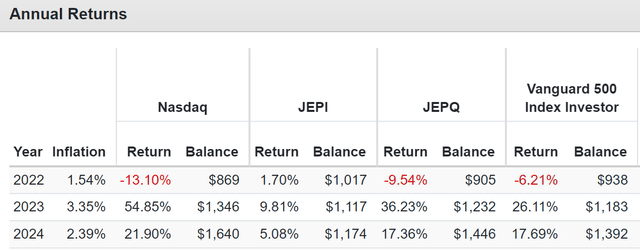
Remember that JEPQ launched in mid-2022, well into the 2022 bear market.
That’s why its 2022 returns, representing the 2nd half of the year, were still down about 10%, worse than the S&P and much worse than JEPI.
That year, it fell 72% as much as the Nasdaq, showing a well-designed strategy from JPMorgan, who delivered on their promises.
However, JEPQ, had it launched in December 2021, in time for the Nasdaq to fall 35% through October 22nd, JEPQ would have fallen 26% at the bottom of the market, essentially just as bad as the S&P.
That’s not necessarily a bad thing, and it’s how JEPQ is designed.
(Source: Portfolio Visualizer Premium)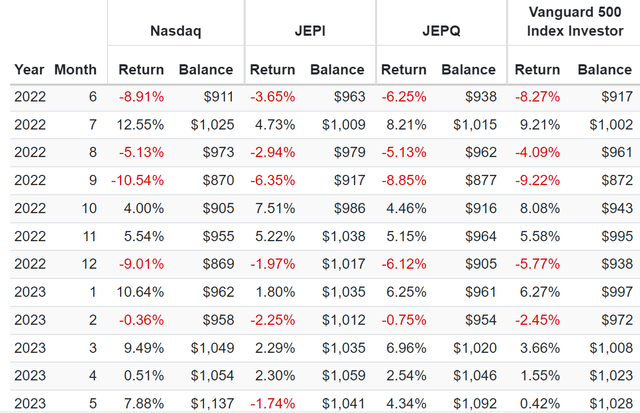
See how, in September 2022, when the Nasdaq fell 11% and the S&P fell 9%, JEPQ fell 9%.
If you buy JEPQ, you have to understand the trade-offs you’re getting.
Plenty Of Profits Left On The Table
JEPQ is designed to capture up to 85% of the Nasdaq’s returns, up to 2.5% monthly gains.
But that’s a monthly average.
Note how in January 2023, when the Nasdaq surged almost 11%, JEPQ was up only 59% as much as the Nasdaq.
What happened? Covered calls and ELNs capped the upside.
As long as the Nasdaq rises slowly and steadily, JEPQ will capture 85% of the Nasdaq’s gains (85% of the portfolio is ELNs to generate income).
If the Nasdaq jumps 10%, 15%, or even 20% in a single month (what can happen after a severe bear market), JEPQ will leave gains on the table because the ELN holders capture the gains.
Remember that JEPQ’s impressive 19% annualized gains are mostly luck. Management says to expect 10% long-term returns.
This outperformance is due to luck, with JEPQ launching halfway into a bear market for the Nasdaq and a V-shaped recovery triggered by the AI revolution.
Ycharts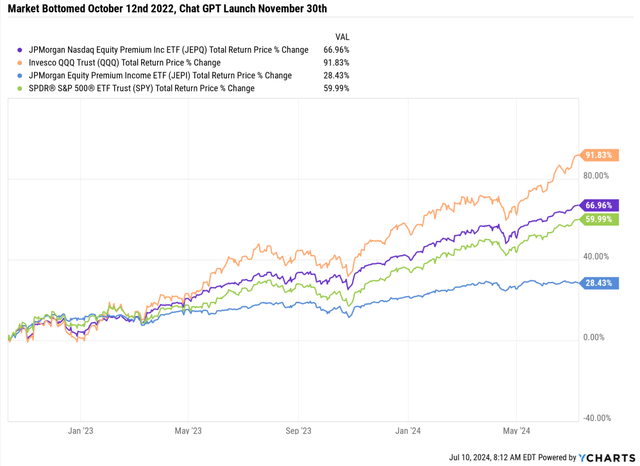
The Nasdaq has almost doubled since the October 2022 lows, which is 100% not what happens in most bear markets.
Does that mean the Nasdaq is in a bubble?
Nasdaq Growth Rates: 92% EPS Growth Since 2022 = 18% Annual Growth
FactSet Research Terminal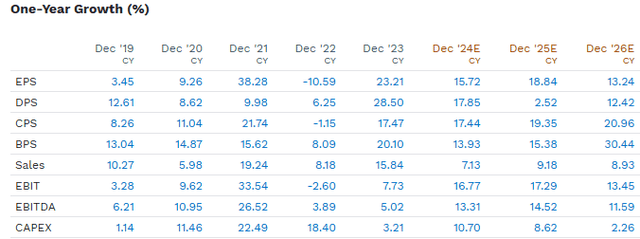
The Nasdaq has been up 92% since October 2022, and the EPS growth has been up 92%. Fundamentals have justified the gains.
However, note that the Nasdaq’s future growth rate of 15%, according to FactSet and Morningstar, is hardly guaranteed.
In other words, JEPQ’s future returns will almost certainly be much lower than those of the past. Remember that JPMorgan’s guidance covers 9% to 11% pre-tax long-term returns.
Don’t Forget About Taxes
| ETF | Pre-Tax Annual Return Since Inception | Post-Tax Return | Tax Expense Ratio |
| JEPQ | 16.87% | 11.82% | 5.05% |
| JEPI | 8.36% | 4.29% | 4.07% |
| SPY (S&P) | 10.13% | 9.48% | 0.65% |
| SCHD | 12.80% | 11.72% | 1.08% |
| QQQ (Nasdaq) | 9.74% | 9.21% | 0.53% |
| VNQ (REITS) | 7.48% | 5.63% | 1.85% |
| BAGPX (60-40) | 6.02% | 4.51% | 1.51% |
| COWZ (FCF Yield, Deep Value) | 13.53% | 12.72% | 0.81% |
(Source: Morningstar.)
Option income, like bond or REIT dividends, is treated as ordinary and taxed at your top marginal tax rate.
College Investor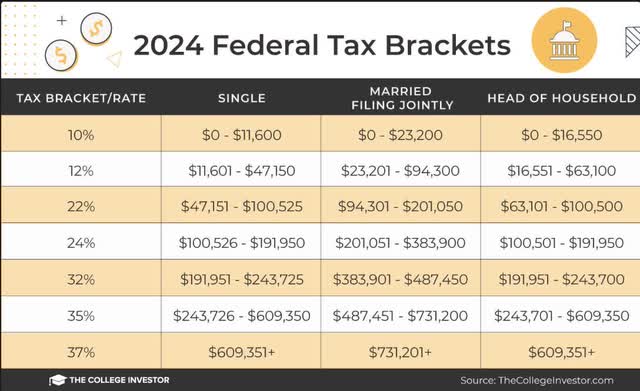
Since inception, 30% of JEPQ’s returns have gone to taxes.
That means JPMorgan’s 9% to 11% total return guidance equals 6.3% to 7.7% post-tax returns.
An optimal strategy is owning JEPQ in a tax-deferred account, like a 401 (k), IRA, or Roth IRA (optimal).
Don’t Forget About Dividend Reinvestment
What many investors don’t know is that the total returns you see are always calculated as tax-free, with zero commission costs, and assuming 100% dividend reinvestment.
Other than zero commissions, those assumptions aren’t true for anyone besides those with a Roth IRA who reinvest all dividends.
Since JEPQ Inception (June 2022)… Tax-Free Dividend Reinvestment
(Source: Portfolio Visualizer Premium)
Since JEPQ Inception (June 2022)… Tax-Free No Dividend Reinvestment
(Source: Portfolio Visualizer Premium)
JEPQ and JEPI are owned for their yield. Bond investors own income bonds (and to hedge against falling stocks).
So, if you don’t reinvest your bond income, the returns aren’t great either.
(Source: Portfolio Visualizer Premium)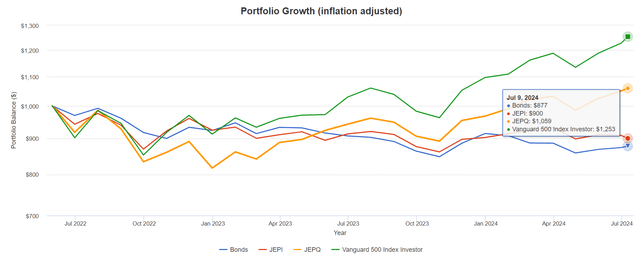
JEPQ, adjusted for inflation and with all dividends spent instead of reinvested, has been up 5.9% since June 2022, an annualized real return of 3% per year.
Given that bonds and JEPI have delivered negative real returns on your principle, that’s impressive.
But remember that 30% of JEPQ’s returns go to taxes.
- -2% inflation-adjusted real return on principle for JEPQ since inception.
Bottom Line: JEPQ Is Wonderful For 2 Kinds Of Investors
JEPI & JEPQ Since June 2022
| Metric | S&P | Nasdaq | JEPI | JEPQ |
| Yield | 1.2% | 0.5% | 7.4% | 8.8% |
| Historical Return (June 2022) | 16.5% | 25.7% | 7.7% | 18.6% |
| Consensus Future Return/Management Guidance | 13.2% | 15.7% | 8.0% | 10% |
| Beta | 1.00 | 1.14 | 0.57 | 0.83 |
| S&P Upside Capture | 100 | 134.94 | 48.34 | 93.56 |
| S&P Downside Capture | 100 | 110.35 | 58.54 | 83.11 |
| S&P Upside/Downside Capture Ratio | 1.00 | 1.22 | 0.83 | 1.13 |
| Conditional Value At Risk | 8.74% | 9.77% | 5.00% | 7.55% |
| Sortino Ratio | 1.10 | 1.60 | 0.51 | 1.38 |
| Treynor Ratio | 12.57 | 18.53 | 6.40 | 16.84 |
(Source: Portfolio Visualizer Premium.)
JEPQ is a brilliant approach to generating maximum monthly income from one of the highest-quality company collections on earth.
According to management, it minimizes volatility while capturing around 70% to 75% of the Nasdaq’s historical upside and generating 9% to 11% pre-tax total returns over time.
I can confirm that, since inception, JEPQ has indeed delivered on its promises regarding volatility and yield.
However, it’s crucial to understand the downsides of its approach, which is that it will be more volatile than JEPI and have more variable income.
JEPQ will likely see soaring yields and crashing prices in a bear market for tech stocks.
Had it launched just a few months earlier, it would have suffered a 26% peak decline.
Its 5% tax expense ratio is approximately 30% of historical returns and might be even higher in the future.
According to management, 50% of JEPI’s historical returns go to taxes, which means JEPQ’s future returns might be just 4.5% to 5.5% post-tax.
Does that mean JEPQ is a fraud? Not at all.
Should no one own it? Not at all; I understand who it’s designed for.
If you own JEPQ in a Roth IRA and reinvest the dividends forever, you have a potentially superior alternative to the S&P 500 or 60-40 portfolio.
If you own JEPQ in a tax-advantaged account, you can defer the tax bill, though not permanently (apart from a Roth IRA).
Even in a taxable account, if you use JEPQ as a source of income instead of a “high-yield Nasdaq ETF,” you are using JEPQ responsibly.
Read the full article here


