Investment Thesis
Let’s get straight to the point: SL Green Realty Corp. (NYSE:SLG) appears to be substantially overvalued, even under the most optimistic assumptions. Evidently, a few other Seeking Alpha contributors find this company to be a buy. So I will play contrarian and argue why one should not buy SLG. Just to be clear, this is not a critique of SLG as a company. SLG is a remarkable company with a strong history in property investment and an enviable portfolio. But like I’ve mentioned in my previous articles, what I concern myself with in my articles is not whether the company is good per se, but whether it is undervalued. As a value investor, I perform thorough valuations, considering all relevant valuation methods and all assumptions within the realm of possibility. My goal is to identify the securities that are undervalued even under the most pessimistic assumptions. And let me be clear: SLG is not only not even close to being undervalued under the most pessimistic assumptions; it isn’t even close to being undervalued under the most optimistic of assumptions. First of all, the dramatically negative trend in the company’s funds from operations (FFO), adjusted funds from operations (AFFO), net income, EBIT, EBITDA, and free cash flow is deeply concerning. Secondly, my discounted cash flow (DCF) model and dividend discount model (DDM) show that SLG is overvalued under almost every WACC/cost of equity and perpetual growth rate assumption within the bounds of plausibility. Third of all, my comps analysis points towards SLG being severely overvalued using EV/EBITDA, P/E, P/FFO, and P/AFFO ratios for gauging the implied value, and only about fairly valued using P/B. Moreover, when the declining NAV trend is considered, my NAV model for SLG also does not show much potential in terms of upside. Furthermore, the stock price of this company has already shown a tremendous rally recently, skyrocketing from $20 in March 2023 to over $60 in July 2024. Although the company was definitely undervalued when the price was $20, I think that the market has since overcorrected and that this rally is far more likely to reverse than continue. Finally, while some trends are in favor of SLG, there are also other trends which do not make the business outlook of the company look very great. Taken together, considering all these factors, I would rate SLG as a “SELL.”
Company Overview
SL Green is a real estate investment trust (REIT) that primarily invests in office buildings and shopping centers in New York City. It is reported to be the largest office landlord in NYC. Its primary focus is on strategic asset management and property acquisition in the quest to optimize values through strategic leasing and property management. As of March 31, 2024, the company held interests in 57 buildings totaling 32.4 million square feet. It also has very much stayed on top of its debt profile. In 2024, it completed $2.1 billion of strategic modifications and extensions of debt as part of its broader strategy to refinance, modify, or extend at least $5.0 billion of existing debt. SLG is also involved in strategic divestments, joint ventures, and acquisitions to further optimize the portfolio. An example includes the sale agreements they signed with properties like 719 Seventh Avenue and Palisades Premier Conference Center while at the same time acquiring a joint venture interest with 10 East 53rd Street. The company deserves an applause for its emphasis on sustainability. It received for the 7th year in a row the ENERGY STAR Partner of the Year Sustained Excellence Award and was included on the Sustainalytics 2024 ESG Top-Rated Companies List. It’s noteworthy that the company remains focused mostly on the NYC market. This specialization affords them a unique competitive advantage in this market.
Financials
Although the financials of the company are strong in absolute terms, the significant downwards trend in many of its key financial metrics, such as net income, funds from operations (FFO), EBIT, EBITDA, and free cash flow (FCF), is very alarming. The net income/loss attributable to SLG common stockholders during 2023 was -$619.629M, compared to -$101.037M in 2022, $459.902M in 2021, $376.121M in 2020, and $268.785M in 2019.
SLG’s 2023 Annual Report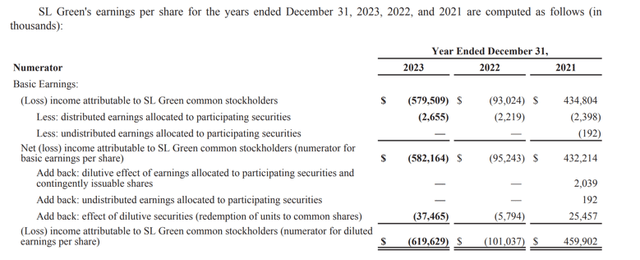
However, FFO is a more appropriate metric than net income for an REIT like SLG, but it also shows a sharp downtrend. FFO was $341.3M in 2023 for SLG, $458.8M in 2022, $481.2M in 2021, $562.7M in 2020, and $605.7M in 2019. Be that as it may, Seeking Alpha claims that, in all fairness, though their FFO has been in decline, SLG has beaten expectations in most quarters. However, in the interest of fairness, it should also be noted that revenues have taken a nosedive and have mostly missed expectations.
Seeking Alpha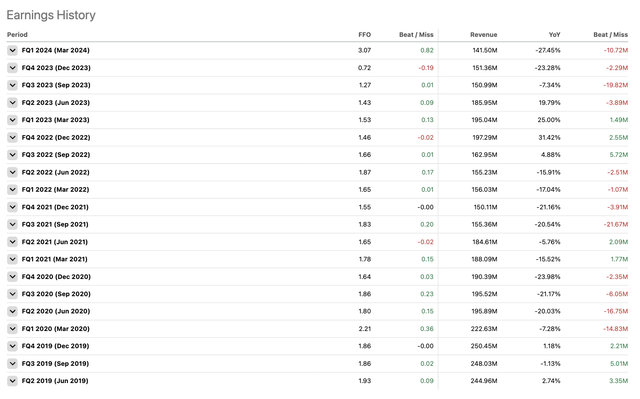
EBIT was $60.528M in 2023, compared to $170.175M in 2022, $167.540M in 2021, and $246.395M in 2020. FCF was $45.748M in 2023 against $138.387M in 2022, $209.557M in 2021, and $20.638M in 2020. Just to understand how low these numbers are in comparison to the company’s historical performance, from 2010 to 2019, the company’s annual FCFs always exceed $500M, ranging between $512.837M in 2010 to $854.215M in 2016. The following table details SLG’s annual free cash flow for each year since 2009:
Macrotrends and SLG’s annual reports
However, what is most worrying about SLG is the decreasing net asset values (NAV), often considered the most important metric when it comes to REIT valuation. In Q1 2024, SLG’s NAV was $4.6812 billion, compared with $5.431410 billion in Q1 2023, $5.843157 billion in Q1 2022, $6.080874 billion in Q1 2021, $6.593793 billion in Q1 2020, and $7.239615 billion in Q1 2019. The table below shows SLG’s NAV for every quarter since Q1 2019:
SLG’s quarterly Supplemental Data reports
These declines are a result of several factors. These include the dramatic reduction in demand for conventional office spaces, a core part of SLG’s portfolio, due to the enormous shift to remote and hybrid working models. And it has actively sold assets to manage debt and maintain liquidity. While these sales have been necessary to reduce the company’s debt burden, and they have indeed resulted in a consistent decline in total liabilities, they have also led to a significant reduction in total assets, with the decrease in assets outpacing the decline in liabilities. Last but not least, SLG’s asset values had been pressured by higher interest rates and economic uncertainties. Although interest rate hikes have been put on hold, they are still on their recent historical highs, so this could still mean trouble for REITs like SLG. There appears to be no sign of either two going in the other direction. Hence, I suspect the slump in SLG’s financials, especially its NAV, will likely persist, although the rate of slide may ease.
Valuation
Normally, when valuing REITs like SLG, you might use either a Dividend Discount Model (DDM) or a Net Asset Value (NAV) model. But discounted cash flow (DCF) and comparable company analysis (comps) models can also be deployed. In this exercise, I tried all four models. In discussing my findings, I will start with the model least appropriate for REITs, the DCF model, and finish with the most appropriate, the NAV model. This does not mean that DCF’s results are completely irrelevant to REITs. It is just that it should be downplayed relative to the others. Besides, in this instance, all of these models show that SLG is overvalued. So throwing in the less-relevant DCF in addition to the others will help me further support my thesis.
Discounted Cash Flow (DCF) Analysis
My DCF analysis doesn’t paint a very rosy picture of SLG’s valuation. I have taken the historical data of EBIT, taxes, D&A, capex, and changes in NWC from the company and projected them over the next five years using Prophet, which is a forecasting tool built by the data scientists at Facebook, and computed the FCFs. Prophet is a forecasting tool in Python and R developed by Facebook’s data scientists, widely known to account for variability, seasonality, holidays, and trend shifts more effectively than other models. This tool is particularly suited to forecast SLG’s financials, as its historical financial patterns are complex (i.e. they don’t have a simple consistent increasing or decreasing trend) and are likely to remain so, a complexity that Prophet is good at capturing. The FCFs projected, using Prophet, are around $216M, $178.8M, $143.5M, $110.2M, and $89.9M for the coming five years. The projections align well with SGL’s historical FCF patterns. My model assumes a market risk premium of 6.63% and a perpetual growth rate of 3%. With a beta of 1.82, SLG has an unusually high cost of equity, which drags down its intrinsic value.
However, please note that in most DCF models the terminal value is equal to the very last FCF projection increased by the perpetual growth rate and divided by the difference between WACC and the perpetual growth rate. However, rather than the last FCF projection ($89.9M), I used the average of the five FCF projections ($147.7M), and my model still shows that SGL is incredibly overvalued. The model gave an intrinsic value of -$30.04, which meant an $85.92 downside (-69.46%) compared to GSL’s price at the time the model was built: $55.88. Please note that this meaningful over-valuation is mainly a result of the company’s being substantially leveraged (although SLG would still be somewhat overvalued according to the model below even if its total debt were $0.0). SLG has about $4.7B in total debt, compared to just $318M in cash and a market cap of $3.6B. This heavy debt load makes the company a high-risk investment, to put it mildly.
Author’s Calculations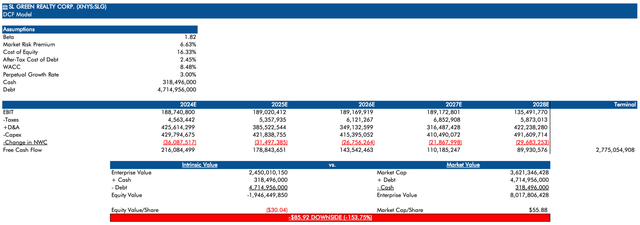
In addition, if you are concerned that seemingly arbitrary assumptions like the perpetual growth rate might unfairly skew the result against SGL, then look at my sensitivity analysis below. Almost any combination of WACC from 6% to 11% and perpetual growth rate from 1% to 5% still points to a significant potential downside for SLG—exception only in the extremely improbable combination of a 6% WACC and a 5% growth rate.
Author’s Calculations
Remember that FFO is arguably a more pertinent measure for REITs, and SLG’s FFOs are much higher than their FCFs. For the sake of comparison, I constructed another model under all the same assumptions as the above DCF model but this time using Prophet forecasts of FFO based on SLG’s historical FFO data instead of FCF. Note that usually FFO does not apply to DCF, making this an unusual approach. So, with that, take these results with a grain of salt. But even with the vastly higher FFO forecasts, SLG is still overvalued compared to the price when this model was built of $56.83:
Author’s Calculations
Comparable Companies (Comps) Analysis
Next up is my comparable companies (comps) analysis. I picked KRC, CUZ, HIW, and DEI as SLG’s peers. The metrics used are EV/EBITDA, P/E, P/B, P/FFO, and P/AFFO. The most important metrics of these are the last two. Please note that although the EBITDA, net income, and FFO figures are for the trailing twelve months (TTM) and the book value is from Q1 2024, the AFFO figures are for the year ending 12/31/2023 because the Q1 2024 AFFO figures, and therefore the TTM figures, are not yet available. Using the median and mean values of each of these ratios for SLG and its peers, the model calculates implied valuations for SLG. Both the mean and median EV/EBITDA, P/E, P/FFO, and P/AFFO ratios indicate substantial downside for SLG compared to its current price. Even the mean and median P/B ratios suggest that SLG is just about fairly valued, with little potential upside.
Author’s Calculations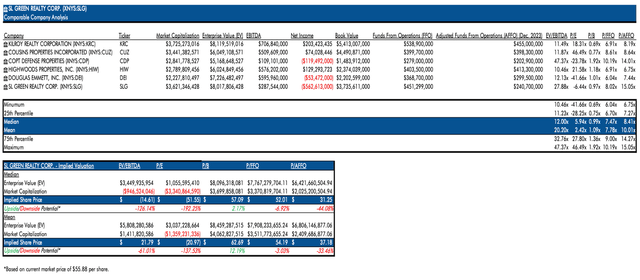
(Sources: Seeking Alpha for FFO and AFFO data, Refinitiv for market cap, P/E, and net income figures, SLG’s financial statements for other SLG figures, and Yahoo Finance for everything else)
Dividend Discount Model (DDM)
Dividend payments are a very big selling point of REITs and should be given high importance when valuing them. SLG has an interesting dividend history, to say the least. Since 2020, they have been paying dividends monthly or nearly monthly: 11 times in 2020, 12 times each in 2021 and 2022, and 10 times in 2023. As of June 2024, they have paid dividends every month in 2024. Pre-2020, they paid dividends quarterly with more payment per distribution. The fluctuation in their annual dividend has been huge, ranging from as little as $2.69 in 2023 to as high as $3.69 in 2022, $3.65 in 2021, $4.66 in 2020, and $3.44 in 2019. For the DDM, let’s consider the most optimistic case where it pays dividends every month for the next five years. In the model below, I used Prophet forecasts for the forecasted case scenario and upper-bound forecasts for the best-case scenario. The DCF should be done with the cost of equity, not on WACC, and SLG’s cost of equity is pretty high, which, fairly or unfairly, skews the results against SLG. But to illustrate just how optimistic the best-case scenario is, it assumes total annual dividends of $7.62 for 2025 and 2026, $7.71 for 2027, and $7.78 for 2028. The firm has never come close to the mentioned figures, with the highest annual dividend ever distributed in any fiscal year being $4.66 back in 2020. Even the forecasted case scenario seems a bit too optimistic, projecting for an annual dividend distribution of $4.48, $4.53, $4.58 and $4.64 for 2025, 2026, 2027, and 2028, respectively. Despite these overly optimistic projections, both the forecasted and best-case scenarios indicate that SLG is overvalued. Under the forecasted case scenario, SLG’s intrinsic value would be $32.18 representing a downside of -$23.70 or -42.41% from its price at the time the model was created of $55.80. In the best-case scenario, SLG remains overvalued by $1.52 (-2.72%) compared to the price at the time the model was created of $55.80.
SLG’s Dividend History (nasdaq.com) Author’s Calculations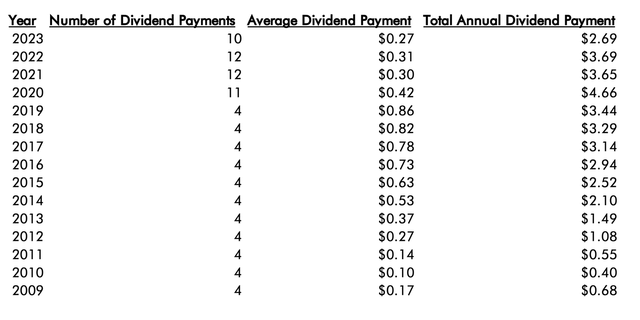
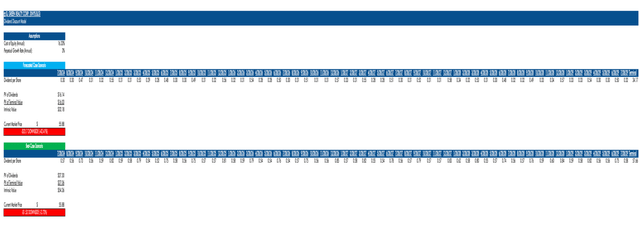
Note that the annual discount rate is 16.33% and the projections are on a monthly basis for five years. This is accounted for by using Excel’s XNPV function rather than the NPV function to determine the present value (PV) of dividends.
According to my sensitivity analysis for the forecasted scenario, SLG remains greatly overvalued on all but a few combinations of cost of equity and perpetual growth rates within the realm of plausibility.
Author’s Calculations
Although it does show consistent upside when cost of equity is 7%, this is completely unrealistic since SLG’s beta is around 1.8. The MRP would need to be about 1.5% for cost of equity to be that low, and that would be nearly impossible. Usually, the MRP is about 5.5%, and I’ve never heard of an MRP under 2%.
Net Asset Value (NAV) Model
Let me start out with some good news: by simply calculating the current NAV based on the latest balance sheet report (Q1 2024) and dividing it by the number of shares outstanding ($4.68112B / 64.805770M), the NAV per share is $72.23, which is higher than the current market price by a respectable margin. However, NAV models do not use the current NAV to determine intrinsic value but rather project future NAV to assess intrinsic value. SLG’s NAV has been on a consistent, significant downward trend, as detailed in the “Financials” section above. To recap, the NAV of the company was circa $7.2B in Q1 2019 and has come down to $4.7B in Q1 2024.
Applying Prophet algorithm to total assets, total liabilities, non-controlling interests, and preferred units to project these items over the next five years and computing NAV based on these forecasts, my model shows that SLG will be overvalued compared to its price at the time of the model’s creation of $56.88 from 2027 onwards. When using NAV models, you try to find companies that will likely remain undervalued compared to their current price level over at least a typical five-year investment horizon, and SLG doesn’t meet this criterion.
To be fair, NAV valuations do yield better for the company than DCF, comps, and DDM models, but they still fall short. Given the at-best mediocre NAV valuation combined with the abominable DDM, Comps, and DCF valuations, I think it’s only fair to state that SLG is considerably overvalued.
Author’s Calculations
Market Trends & External Factors
The trends that are affecting REITs in 2024 become clear, and I see that SLG, as many other REITs, is in a mixed bag. Now that the Federal Reserve has paused on its rate hikes, the picture could improve for REITs as borrowing costs stabilize, potentially increasing investment and acquisition opportunities. But the negative effects of previously high rates may continue to pummel REITs. The gap between public and private real estate valuations is expected to close in 2024, making REITs more attractive to investors. Public REITs are likely to benefit by buying undervalued assets from the private markets. Normalizing work from home will likely persistently erode the demand for the traditional office space that makes up a significant part of SLG’s portfolio. Plus, increasingly stringent environmental regulation should lead to high investment in sustainable infrastructure, driving up operational costs. Overall, the trends in the market for REITs are a mixed bag of opportunity as well as substantial challenge. However, even in the most optimistic of scenarios, the positive trends are not even close to being sufficient enough to offset the substantial overvaluation of SLG as indicated by various valuation methods.
Conclusion
In conclusion, SL Green has a good history and a notable portfolio but is overtly overvalued. From the financial metrics point of view, the indicators are in a clear downward trend. My valuations, including DCF, comps, DDM, and NAV models, under very optimistic assumptions, either show SLG to be highly overvalued or, at best, just about fairly valued. It is vulnerable to other external risk factors like the easing demand for office space and high interest rates. Even if there are some possible positive trends in terms of stabilizing borrowing cost and a diminished gap between public and private real estate valuations, it is still improbable that these will be enough to compensate for the huge overvaluation. And beyond that, the share price is already up from around $20 last March 2023 to above $60 in July 2024, and it does not seem very likely that it will rise much further than it already has. Overall, I see SLG as a high-risk play with limited upside, and I would rate it as a “SELL.”
Read the full article here


