Disinverting Yield Curve: The Calm Before the Storm?
In anticipation of the likely interest rate cuts next week, investors are adrift in a sea of uncertainty as markets have slipped on the back of ambiguous economic data. The August jobs report released last Friday showed a decrease in the overall unemployment rate, albeit only marginal, and contributed to the Nasdaq and S&P 500 posting their worst weeks since 2022 and 2023, respectively. Markets bounced back Monday morning, with cyclical sectors leading the pack; however, given September’s poor historical track record, investors should consider how to position a portfolio for a potential recession.
Another indicator that has caught market-watchers’ attention is the disinverting yield curve. The yield curve, also known as the 2/10 curve, visually represents the difference in returns between short-term and long-term bonds. Normally, the yield curve slopes upwards, with higher yields paid for longer-term maturities, compensating investors for risks like inflation associated with long-term investments. Conversely, those invested in shorter-term maturities take less risk and receive a lower payout until the security matures. However, an inverted yield curve can occur when yields for shorter-term maturities exceed those of longer-term maturities.
Normal vs. Inverted Yield Curve
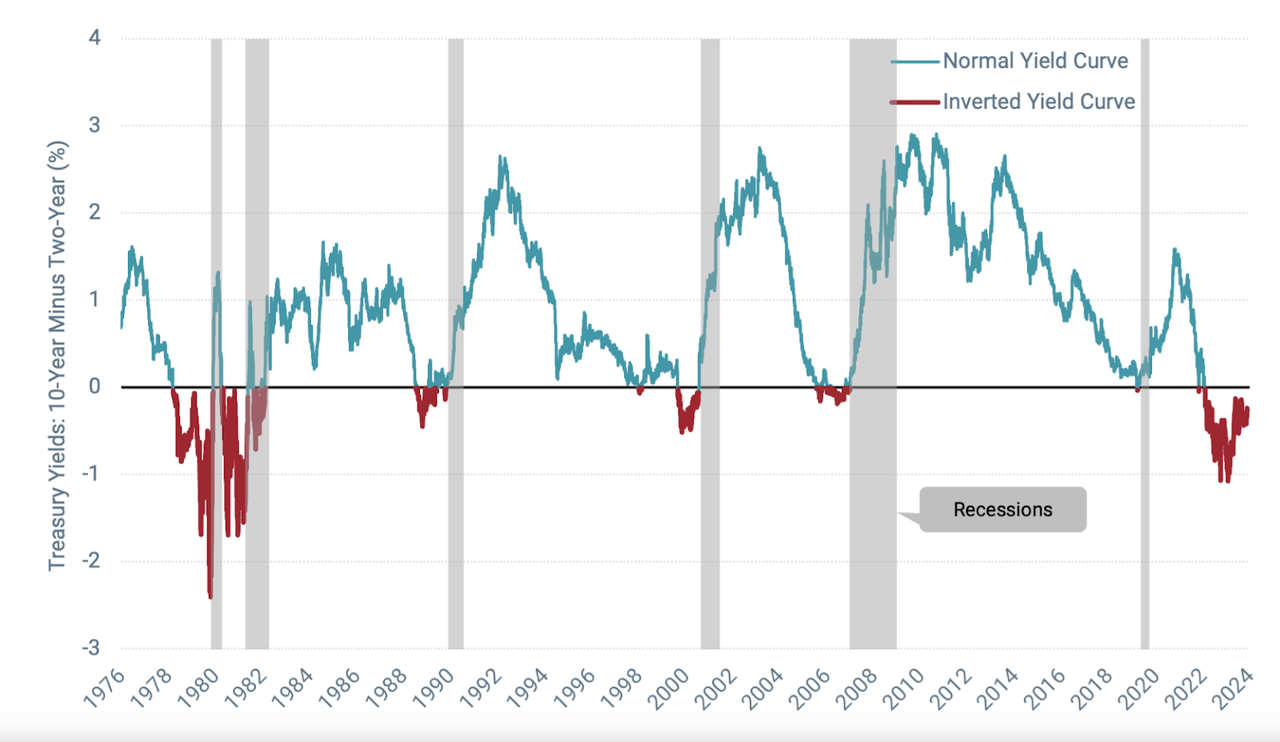
Normal vs. Inverted Yield Curve (Avantis Investors)
Since 1955, the inversion and subsequent disinversion of the yield curve have preceded recessionary periods every time, except in 1966. The most recent inversion of the yield curve took place in March of 2022, as short-term rates were ratcheted up to fight the ballooning inflation in the US. However, in August the curve briefly disinverted for just the second time since 2022, and once again last week, which could be a sign that the looming recessionary period is on the horizon. However, it is worth noting the curve’s reliability as a prognosticator has been disputed. Regardless of whether or not a recession is imminent, the confluence of soft labor data, historical September volatility, and interest rate reductions on the horizon could be reason enough for investors to build up their defensive positioning in their portfolios.
Top Defensive Stocks
Businesses in defensive sectors are less sensitive to economic fluctuations because they provide products and services consumers will buy despite downturns. Food, health services, and electricity are examples of sectors that offer resilient qualities and tend to outperform during recessionary periods. Consumer staples, utilities, and health care outperformed the market by an average of 10% in six of the last seven recessions since 1960, excluding the two-month COVID downturn in 2020, when the S&P 500 plummeted over 30% but rebounded to finish the year +15%.
This article spotlights two top Quant-rated stocks that score highly on Seeking Alpha’s Factor Grades and are rated “Strong Buys.” Both of the stocks have experienced outperformance on a trailing one-year basis, are in differentiated sectors and industries, and based on Quant ratings, have the potential to outperform market movements in September and beyond.
1. Tenet Healthcare Corporation (THC)
-
Market Capitalization: $14.68B
-
Quant Sector Ranking (as of 9/10/24): 9 out of 1029
-
Quant Industry Ranking (as of 9/9/24): 1 out of 14
-
Quant Rating: Strong Buy
Tenet is a diversified healthcare services company with a national acute care and specialty hospital portfolio. THC’s network includes over 535 surgical facilities and the largest ambulatory surgery platform in the U.S. Tenet Healthcare has delivered roughly +112% in the last year and +20% since making SA Quant’s Top Stocks by Sector list on May 16, 2024. THC is #1 among quant-rated Health Care Facilities Stocks driven by A’s in Valuation, Profitability, Momentum, and Revisions.
THC Stock Factor Grades
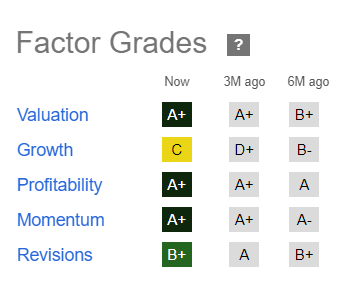
THC Stock Factor Grades (SA Premium)
THC topped Q2 earnings estimates and raised guidance, crediting volume and revenue growth from sustained fundamentally strong operating performance. Portfolio transformation provided opportunities for growth as Tenet continued to broaden its service offering for patient-centered care. THC EPS of $2.31 beat by $0.40 and revenue of $5.10B beat by $99.66M. Adjusted EBITDA rose 12% YoY to $945M and well above the upper outlook range. FY24 outlook was raised by $300M to a range of $3.83B to $3.98B.
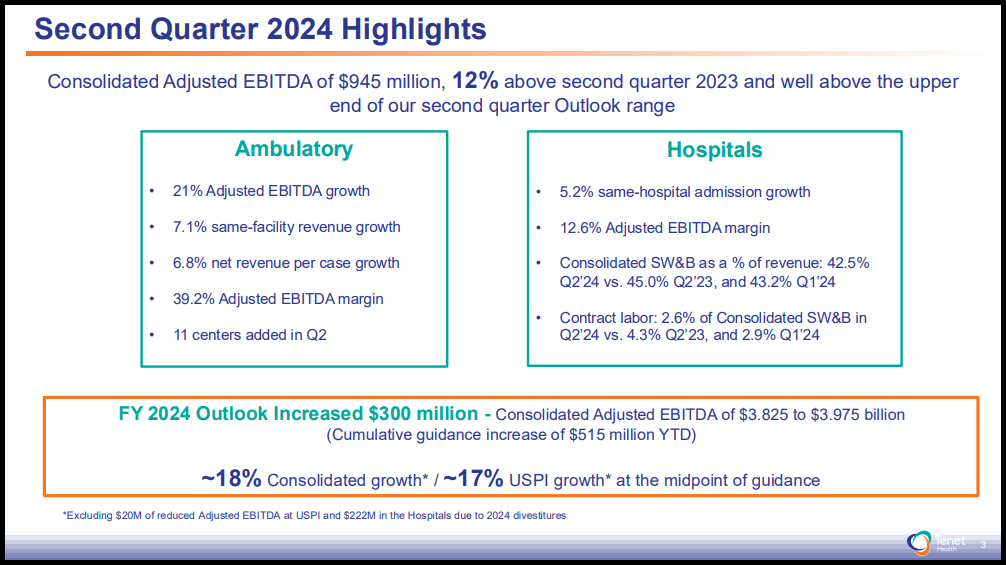
Tenet Healthcare Corporation Q2 Investor Presentation (Tenet Healthcare Corporation)
THC’s ‘A+’ Profitability Grade is underpinned by ROE of 114.36% and operating margin TTM of 14.70% vs. 2.40% for the sector. The company is trading at an attractive valuation with PEG FWD of 0.68x representing a 65% discount to the sector, and a price/cash flow of 7.28x vs. the sector’s 16.45x. THC is extremely profitable, as showcased by an incredible $2.66B cash from operations. Additionally, THC has $30.06 cash per share on a trailing twelve-month basis, versus the sector’s $1.27 and levered cash flow +362% YoY, so it’s no surprise that 16 analysts have revised up in the last 90 days with EPS projected to grow +53% in FY24. Amid market and economic uncertainty, a healthcare stock with robust fundamentals like THC can insulate portfolios from inflation and volatility.
2. Post Holdings, Inc. (POST)
-
Sector: Consumer Staples
-
Quant Sector Ranking (as of 9/10/2024): 11 out of 188
-
Quant Industry Ranking (as of 9/10/2024): 5 out of 53
-
Market Capitalization: $6.81B
-
Quant Rating: Strong Buy
POST is a top quant-rated consumer staples holding company that operates through four main segments: Post Consumer Brands, Weetabix, Food Service, and Refrigerated Retail. While POST is most closely associated with popular American cereals like Fruity Pebbles and Honey Bunches of Oats, the company produces a variety of other products such as pet food, peanut butter, and egg products. In the most recent quarter, POST delivered a net sales increase of 5%, which the company attributes to M&A activity. POST’s recent acquisitions have been primarily in the pet food space, which has been a key driver of growth for the company.
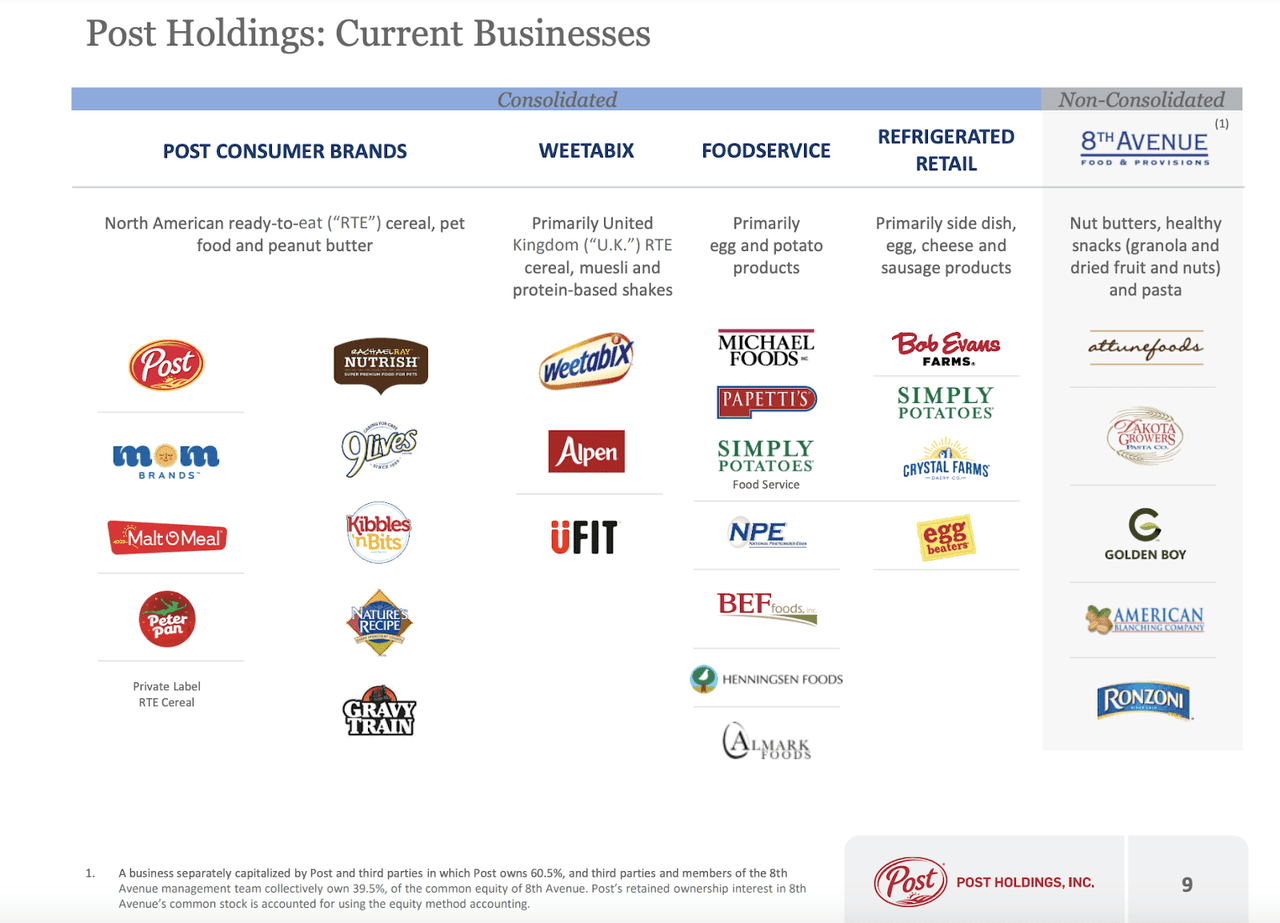
Post Holdings, Inc. Q3 Investor Presentation (Post Holdings, Inc.)
POST scores well across several key growth metrics. Its year-over-year and forward revenue growth stands at 18.62% and 10.97% respectively, which are significantly higher compared to the sector median. Its strong quarterly performance allowed the company to raise its full-year guidance, and Wall Street analysts have followed suit, with 9 upwardly revised EPS estimates in the last 90 days.
POST Stock Profitability Grade
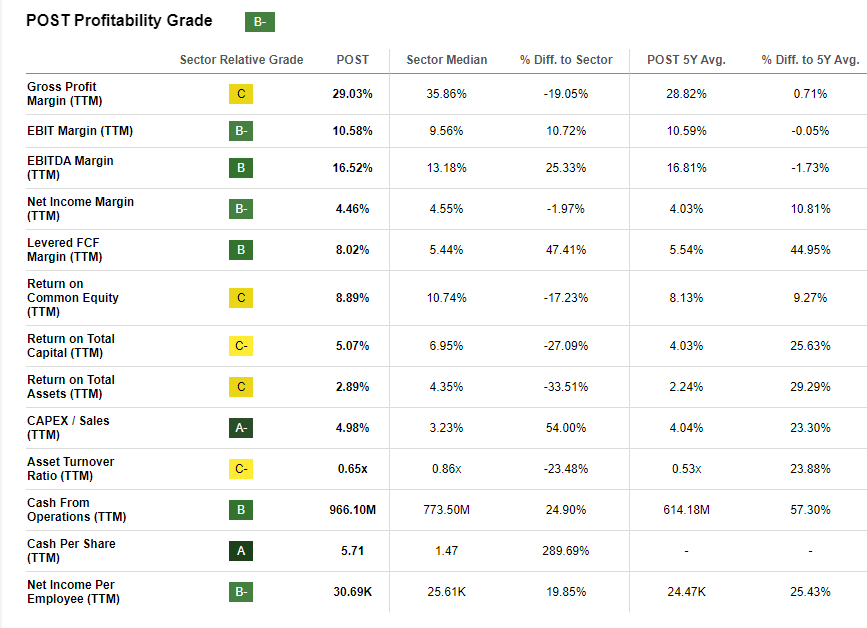
POST Stock Profitability Grade (SA Premium)
Despite the challenging consumer environment, where higher prices have pushed consumers to cheaper, private label goods, POST scores above average on several profitability measures. The company’s TTM EBITDA margin is 16.52%, which is a 25.33% increase relative to the sector median, and its operational health is evidenced by its strong level of cash from operations, which totals to 966.1M.
POST Stock Price Return vs. the S&P 500
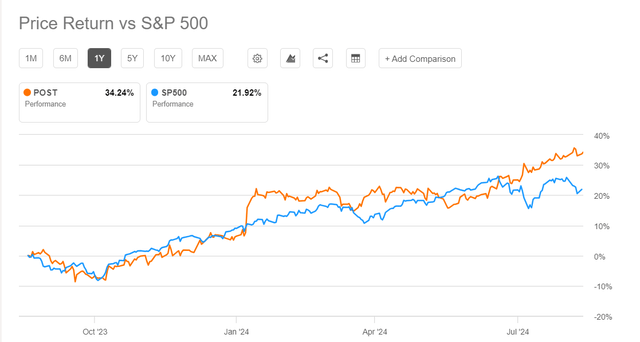
POST Stock Price Return vs. the S&P 500 (SA Premium)
In addition to earnings revisions, growth, and profitability, POST boasts excellent price momentum throughout the last year, and has outperformed the S&P 500 in the same period. Despite the recent gains, POST is still delivering some attractive valuation characteristics, including a price-to-book ratio of 1.73, representing a -33% reduction to the sector median. POST’s fundamentals and its status as a defensive stock make it well-suited for investors looking to position themselves for a potential recession.
Concluding Summary
The recent disinversion of the yield curve, coupled with tempered economic data and the anticipation of rate cuts, has sparked discussions about the potential for an upcoming recession. While the yield curve’s reliability as a predictor of recessions can be argued, its track record, and the current financial climate suggest that investors might want to adjust their portfolios for a sustained period of economic uncertainty.
Defensive sectors like consumer staples and healthcare have historically outperformed during recessionary periods. SA Quant has identified two well-rounded defensive stocks with the potential for capital appreciation. Tenet Healthcare Corporation and Post Holdings, Inc. are both rated “strong buys” based on SA Quant factor grades and SA Quant ratings.
We have many stocks with strong buy recommendations, and you can filter them using stock screens to suit your specific investment objectives. Consider using Seeking Alpha’s ‘Ratings Screener’ tool to help find stocks that achieve diversification into desired sectors you like. Or, if you’re seeking a limited number of monthly ideas, consider exploring Alpha Picks.
Read the full article here


