Back at home we all have a lot of work to do, but from here, Earth sure looks like a perfect world.
–Jared Isaacman
This past week, SpaceX successfully completed the first ever commercially operated spacewalk. The mission’s benefactor — billionaire Jared Isaacman — commanded the mission and performed the extravehicular activity.
(Maybe money can’t buy you happiness, but it can buy you a spacewalk!)
The quote above were his first words as he emerged from the depressurized crew capsule and looked down on Earth from 740 kilometers (about 460 miles) above the ground.
As a sci-fi and space nerd, there’s nothing I find more inspiring and energizing about the future of humanity than moments like this.
My own investment portfolio is decidedly grounded here on Earth, but I do have one stock holding with meaningful exposure to the space economy. And you know what? I actually think it’s a pretty good buy right now, so I added it to my buy list. I’ll discuss it below, but we have other ground to cover first.
Here’s the agenda:
- The primary drivers of inflation have run their course and are well behind us now
- The “transitory inflation” thesis was right… sort of
- The magnetic repulsion of the energy and real estate sectors, and why these two make good hedges or complements to each other
- Where my dividend stock buy list stands today
Onward.
The Inflation Floodwaters Recede
Like the crew of the SpaceX Polaris Dawn, let’s fly up to 740 kilometers above the economy to get a big picture view. It always helps to understand where we’ve come from to get a general sense of where we’re going.
In past articles, I’ve argued that there were three primary drivers of the inflationary surge from 2021 to 2023:
- A huge and sudden increase in the supply of money circulating in the economy
- A huge and sudden disruption to supply chains and production
- A huge and sudden drop in the labor force, followed by a spike in job and wage growth, leading to a short-lived wage-price spiral
All three are definitively gone today. They have fully run their course after the major shocks and ripple effects they delivered to the economy. The floodwaters are receding.
Let’s look at some charts that illustrate this.
First, on the money supply, we can see the absolutely massive influx of money in 2020 and early 2021 from COVID-era stimulus spending by the US government, which resulted in a massive wave of inflation starting almost exactly a year later.
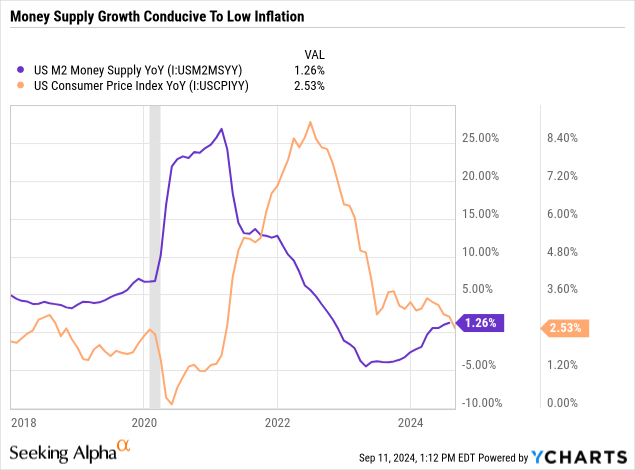
Today, however, the money supply has recently returned to slightly positive growth after over a year of declining.
The huge surge in savings and disposable (spendable) income consumers enjoyed in 2020 and 2021 was gradually depleted over the following years, which explains how consumption has grown significantly more than disposable income over the last three years.
Pantheon Macro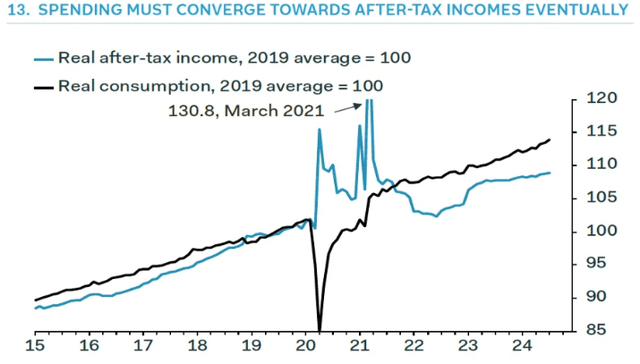
Obviously, this gap between consumption and disposable income cannot last forever. Indeed, we are now seeing signs that consumers are reining in spending and/or more heavily utilizing credit cards.
Short of another major round of stimulus spending that creates another swell of dollars (especially if it puts those dollars directly into consumers’ pockets, as the COVID stimulus spending mostly did), the money supply growth now appears to be sustainably conducive to low inflation.
On the supply side of the economy, COVID also caused a major shock by kinking up global supply chains and cutting back production all across the world.
We can see this in the sudden drop in imports and retail inventories in 2020.
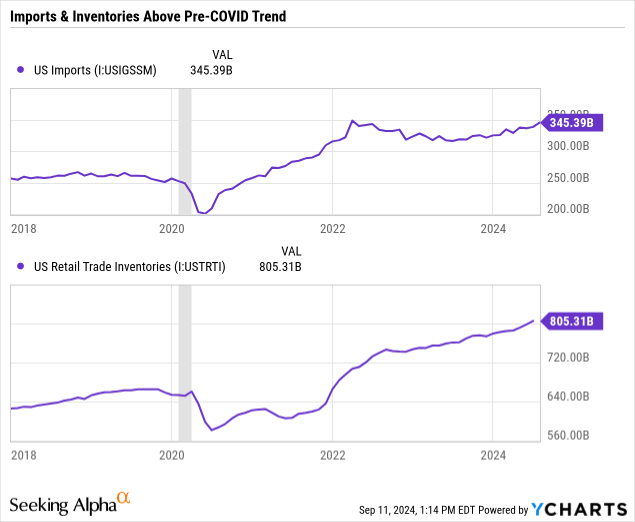
Production was revived relatively quickly, and imports likewise rebounded within a year, but the damage was done. Shortages of goods became inevitable in 2020 and were experienced for the better part of two years.
As we stand today in 2024, however, imports are flowing into the US with no 70+ container ship backlogs at ports, and retail inventories have rebounded back to their pre-COVID trend growth line on an inflation-adjusted basis. In fact, adjusted for inflation, retail inventories are slightly higher today than immediately prior to the pandemic.
Finally, consider the job market.
During the pandemic, workers became hard to find because stimmy checks and enhanced unemployment benefits were often more attractive than returning to work.
Beginning in late 2020 and especially over the course of 2021, private sector job growth began to rebound with a vengeance.
The Daily Chartbook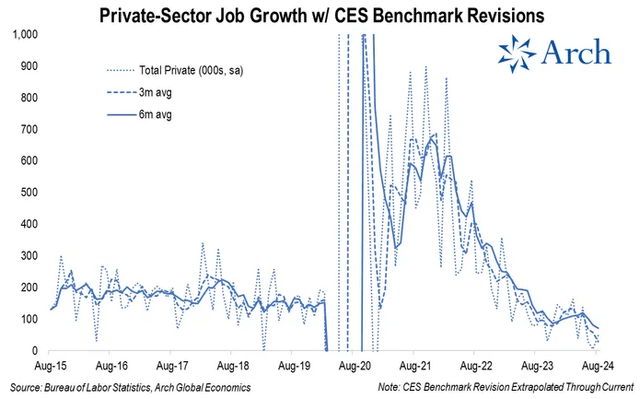
The post-COVID boom, fueled by cash-rich consumers, drove a robust labor market for three years. But over the last year or so, almost everyone who wanted a job has been able to find one, and the number of job openings has been on the decline as the economy cools.
Today, private sector job growth is now well below its pre-COVID average level, and its decline does not appear to be over.
Will this eventually lead to job losses and recession? That debate remains ongoing, but what is undisputable is that the current level of job growth is no longer fueling or facilitating inflation.
Neither for that matter, is the current level of wage growth.
Indeed Wage Tracker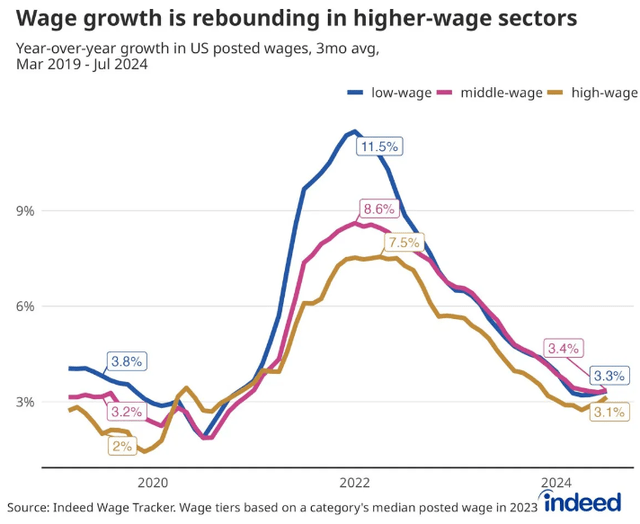
In 2021 and 2022, employers had to raise wages to attract workers back into the labor force. For the most part, this wage growth was a result of inflation, as workers required higher wages in order to absorb higher prices. But to some degree, it also fueled a temporary wage-price spiral by allowing workers to absorb the higher prices without pulling back on the volume of their consumption.
This wage-price spiral turned out not to be self-sustaining, though, as evinced by the steady drop in both inflation and wage growth from 2022 to 2024.
Today, wage growth appears to be flattening out a little over 3%, which is about the same level as was present prior to COVID. This may continue to decline as the CPI declines further.
With all three major drivers of inflation over the last several years now behind us, I believe (as I have been arguing for a while) that the economy is returning to its pre-pandemic state of low inflation.
Team Transitory Was Right (Sort Of)
Transitory: (1) of brief duration; (2) temporary; (3) not persistent
Remember the “transitory versus sustained” inflation debate from a few years ago?
Given the information presented in the section above, I think it’s fair to say that Team Transitory was right… at least, mostly.
According to the possible definitions of “transitory” above, two out of three turned out to be applicable to the inflationary surge of the past several years. It was temporary and not persistent, but I think it would be fair to say that the inflation was not as brief or mild as Team Transitory expected.
I think the core of the Team Transitory argument was that the causes of inflation were unique, one-time, and non-recurring, and therefore that the inflation would be a one-time and non-recurring spike to be followed by a return to normalcy once the idiosyncratic factors had run their course.
Where Team Transitory was wrong was in the degree of inflation that would manifest as well as the length of time it would take to run its course. Once it became clear that inflation was going to be neither mild nor brief (relative to expectations), Jay Powell retired the phrase “transitory” from his rhetorical repertoire.
But Team Sustained (or “Higher For Longer”) were more fundamentally wrong than Team Transitory.
Remember, Team Sustained was basically arguing that the world is fundamentally different today than before COVID-19 (as well as the Russia-Ukraine war and the rise of trade wars) and that this new environment had reversed all the disinflationary trends of the last 40 years.
Globalization has given way to deglobalization, commodity prices will continue to rise indefinitely, the upshift in government spending will continuously fuel inflation, and so on.
All wrong.
US imports are near an all-time high. China’s seemingly bottomless appetite for commodities to fuel the construction of its ghost cities has come to an end, spurring the CCP to subsidize overproduction of goods in order to maintain employment. Even if the US government doesn’t allow China’s excess production to be dumped into the US, it will find its way into other global markets and lower prices elsewhere, and those lower prices will spill over into the US economy in other ways.
And, of course, even as US government deficit spending remains at a ~$2 trillion annual pace, inflation is falling like a rock.
Here’s the private sector consumer inflation aggregator Truflation, currently showing a shockingly low year-over-year inflation number of 1.06% as of September 12th 2024:
Truflation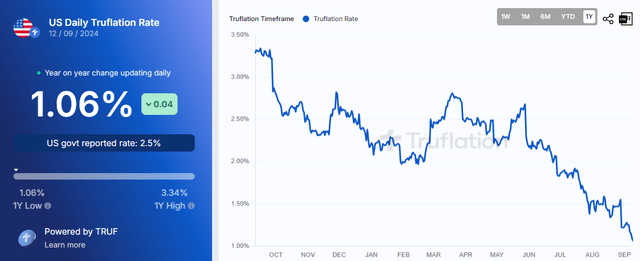
Truflation showed a much higher peak level of inflation in 2022, reaching into the double-digits, compared to the CPI. But today, it is showing a significantly lower level of inflation than the CPI.
The August CPI report shows widespread disinflation (and even some deflation, such as in durable goods like cars, appliances, and furniture) across the economy.
Only one item actually ticked up in August: the absurdly opaque and inaccurate “Owners’ Equivalent Rent,” which commands a whopping ~27% weighting in the CPI basket. As I’ve ranted about in the past, OER is not hard data. It doesn’t track actual home prices or the real monthly costs of homeownership. It’s soft and subjective data based on a survey asking homeowners what they think they could rent their home for. I’ve shown how it generally tracks with CPI Rent… except for August 2024, when CPI Rent inflation continued its disinflationary path even while OER rebounded.
Why did OER increase in August? It’s a mystery that even confounds economists.
OER is the only reason that YoY core CPI stayed basically flat in August even though headline CPI (which incorporates falling gasoline prices) fell precipitously.
If a metric as wildly disconnected from reality as the OER causes the Fed to slow their planned rate-cutting path, the odds of a near-future recession (which I already find likely) go up considerably.
Anyway, back to the subject at hand: Team Transitory was mostly right. Team Sustained was mostly wrong.
Energy As A Complement To Real Estate
As longtime readers of mine probably know, my background is in real estate, and since that is my core competency, my portfolio is heavily tilted toward real estate investment trusts (“REITs”). REITs currently make up about 44% of my total portfolio. No advisor would recommend that much exposure, but when it comes to owning individual stocks, I believe it’s a good idea to invest in what you know and understand.
That said, even I would like enough diversification in my portfolio to the point where something is always working while something else is struggling. If everything is working or struggling in roughly equal measure, that could be a sign that my holdings are too highly correlated to one another.
Perhaps it has been clear to others already, but it only recently dawned on me that energy stocks are the best hedge for REITs, and vice versa.
If you look closely at a chart of the price performance of the Vanguard Real Estate ETF (VNQ) versus that of the SPDR Energy Sector ETF (XLE), you’ll find that they are almost mirror opposites of each other.
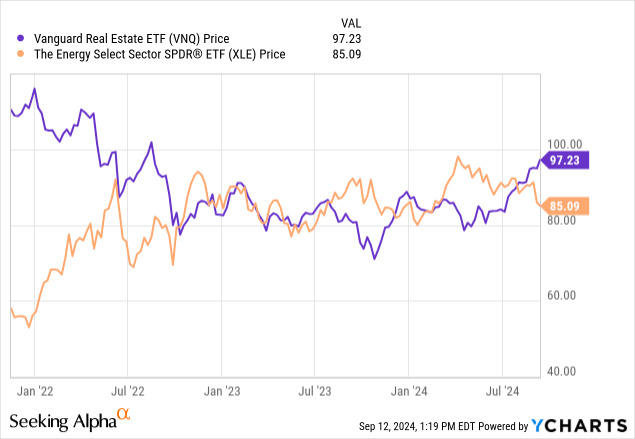
When energy rises, REITs fall. When energy falls, REITs rise.
I already have a sizable exposure to the midstream energy sector through Enterprise Products Partners (EPD) and Enbridge (ENB), as well as the Global X MLP & Energy Infrastructure ETF (MLPX).
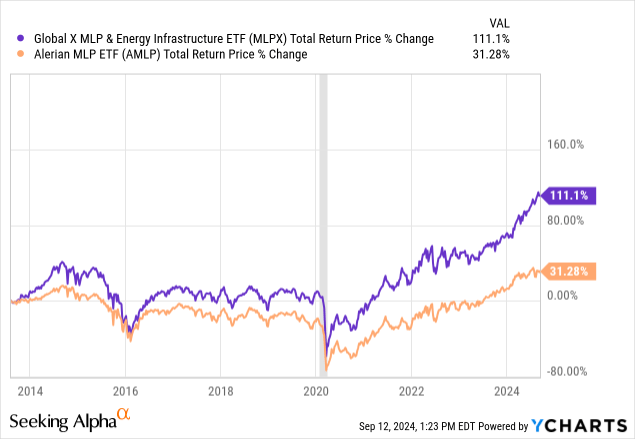
MLPX’s portfolio is split roughly 75% C-corps and 25% MLPs for tax purposes, and it holds the natural gas mega-winners like Cheniere Energy (LNG) and Williams Companies (WMB). These nat-gas winners are a big reason it has dramatically outperformed its MLP-only peer, the Alerian MLP ETF (AMLP):
But it should be noted that the midstream energy sector doesn’t act like the exploration & production sector. Midstream companies like EPD and ENB overwhelmingly derive revenues from fixed-rate, take-or-pay contracts for their infrastructure assets. Very little revenue is tied to commodity prices or even to the volume of commodities that pass through its infrastructure.
It is really the exploration & production side that behaves opposite REITs. Take a look at VNQ’s price performance compared to that of the iShares US Oil & Gas E&P ETF (IEO):
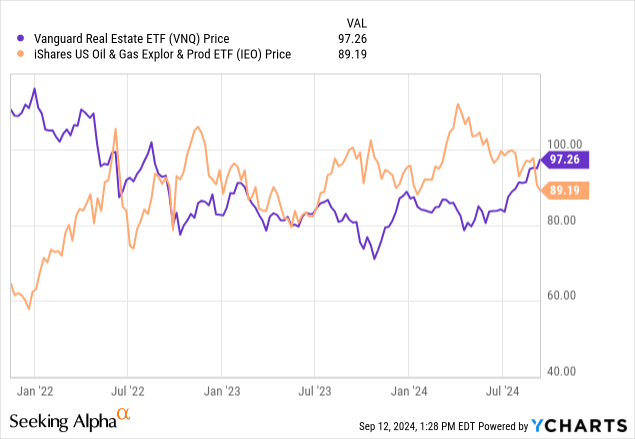
It is rare to see such strongly negative correlation in the stock market as this.
It makes sense. E&Ps are naturally correlated to inflation, at least to some degree, while REITs are negatively correlated to inflation.
Now, I am almost always too early in starting to buy stocks in slumping sectors like this. I don’t claim the ability to time the bottom.
But as REITs rally, slumping oil & gas producers are becoming more interesting to me. Some, I think, have become buyable in recent weeks.
The Buy List Today
That’s a convenient transition to my buy list, which now has three oil & gas producers on it, two of which I already own and a third that I’d like to start buying soon.
| STOCKS | Dividend Yield | Projected Dividend Growth Rate (Guesstimate) |
| Comcast (CMCSA) | 3.2% | Mid- to High-Single-Digit |
| Canadian Natural Resources (CNQ) | 4.6% | Mid- to High-Single-Digit |
| Chevron (CVX) | 4.7% | Mid- to High-Single-Digit |
| EOG Resources (EOG) | 3.1% | High-Single-Digit to Low-Double-Digit |
| Trinity Capital (TRIN) | 14.7% | Flat to Low-Single-Digit |
| ETF | ||
| iShares 0-3 Month Treasury ETF (SGOV) | 5.2% | N/A |
I’m still devoting some investable cash to SGOV as a way to build a cash position, but my plan is to devote some incremental capital to these 5 dividend stocks in the coming weeks as well.
Comcast
CMCSA is one of those media and entertainment conglomerates that is so vast and diversified as to be hard to talk about in broad strokes.
The Xfinity broadband business is an industry leader and has a lot of competitive advantages, but it also has competition from fiber.
Universal is a top-tier studio that has enjoyed some successful movies recently, but it is always subject to the vicissitudes of audience tastes.
The world-class theme parks are another cool but somewhat cyclical asset, and Epic Universe is scheduled to open in 2025 amid what could be a malaise in consumer spending.
Meanwhile, cable cord-cutting continues, and NBCUniversal’s streaming platform, Peacock, still isn’t profitable. The Olympics probably gave Peacock a boost, though.
What I like about CMCSA is its high and steady free cash flow generation, which has allowed the company to steadily and prudently grow its dividend while maintaining a low payout ratio (about 1/3rd of FCF), deleverage from over 3x EBITDA in 2020 to 2.3x today, fund continuous buybacks, and invest in future revenue generators like Epic Universe.
CMCSA is a textbook example of QARP — “quality at a reasonable price.”
Canadian Natural Resources
CNQ owns and operates long-lived, slowly depleting oil & gas assets in Canada and has ample identified reserves, especially in the oil sands region of Alberta. As a result of its low maintenance costs of oil production, CNQ is a free cash flowing machine.
Moreover, CNQ has a very low breakeven cost of about $41, meaning that the price of oil would need to reach $41 a barrel for CNQ’s FCF to be zero. That compares to a breakeven price of about $62 a barrel for the average oil producer to earn a profit from drilling a new well.
With its gusher of FCF, CNQ has been deleveraging, aggressively buying back shares, raising its dividend, and building up a cash position of $915 million as of Q2 2024.
At a net debt to EBITDA of 0.6x, CNQ’s leverage has virtually never been this low.
Chevron
I’ve already written about Chevron in the past, so I’ll keep it brief here.
In short, CVX has also done a lot of work to clean up its balance sheet and increase free cash generation over the last several years. Net debt to EBITDA now sits at about 0.4x, and the company’s FCF yield is about 7%.
The dividend has scarcely ever been better defended, and the 36-year dividend growth streak looks highly likely to continue on for the foreseeable future.
EOG Resources
EOG’s dividend yield is lower, but its double-digit dividend growth rate has been significantly faster than that of CNQ and CVX.
Interestingly, EOG used to be known as “Enron Oil & Gas,” but it was not one of the fraudulent parts of the old Enron. Today, EOG is arguably one of the highest quality oil & gas producers in the nation. It has a $40 breakeven price, zero net debt (because its $5.4 billion in cash is larger than its $3.25 billion in debt), and a roughly 15% FCF yield.
Although EOG has not raised its dividend every year, it has also not cut its dividend over the last 32 years either. And paying out only about 1/3rd of its FCF right now as dividends, the dividend looks extraordinarily safe.
EOG’s historical policy has basically been to increase the dividend when the price of oil is rising and hold it flat when oil is falling. That’s okay with me.
Trinity Capital
An almost 15%-yielding stock? Surely, that must be a yield trap, right?
Well, actually, there’s a lot to like about TRIN, despite its risks.
TRIN is a business development company (“BDC”) largely focused on venture capital-backed growth businesses but with lending segments such as equipment financing and life science. As an internally managed BDC (big plus in my eyes), TRIN has also recently begun doing asset management, partnering with private equity investors on senior loan funds. That opens up a new stream of revenue, namely management fees.
TRIN’s NAV per share stood at $13.12 as of Q2 2024, which puts its current price of a little under $14 at a premium to NAV of about 6%. That’s quite low as far as internally managed BDCs go.
As I discussed in “4 Stocks I’m Buying As Inflation Disappears And BDCs Look Toppy,” three other internally managed BDCs — Main Street Capital (MAIN), Capital Southwest (CSWC), and Hercules Capital (HTGC) — all have premiums to NAV in the 50-65% range.
Don’t get me wrong. Those three are high-quality BDCs, and I’m happy they trade at such premiums. It makes their costs of capital much lower and allows them to pursue higher quality, lower yielding loans. But shouldn’t TRIN’s premium be a bit closer to theirs?
Interestingly, TRIN has the largest exposure of any BDC I’m aware of to the burgeoning space economy.
TRIN Q2 2024 Presentation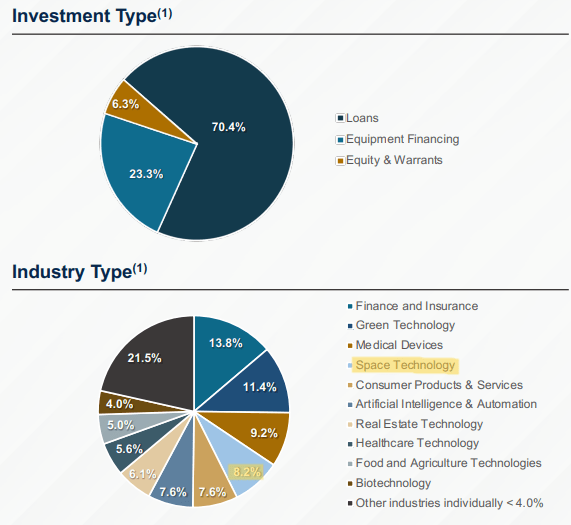
A little over 8% of its loan portfolio is in space technology companies like Rocket Lab (RKLB), Axiom Space, and Space Perspective.
After quarter end, TRIN also announced a $20 million loan to Kymeta, a flat-panel satellite antenna company, as well as $30 million in debt financing for Slingshot Aerospace, a space data provider.
These are cash-burning businesses, admittedly. Many of TRIN’s borrowers are, which is a big reason for the perception of TRIN as high-risk. At the same time, TRIN’s borrowers tend to have strong backing from VC or PE sponsors and low overall leverage levels. As of Q2, 2024, TRIN’s borrowers had average debt to assets of a little under 15%, inclusive of their loans from TRIN.
Moreover, these borrowers actually handled the rising interest rate environment fairly well. TRIN has had hardly any defaults/workouts over the last few years.
TRIN Q2 2024 Presentation
Today, as you can see, defaults remain very low, and the watch list of potentially troubled loans is not growing.
Can TRIN maintain its dividend once the Fed reduces its policy rate by 225 basis points, as is expected by the end of 2025?
Assuming no increase in loan defaults, I think they can. TRIN is actually a little less exposed to falling interest rates than many of its BDC peers. It has 12% floors on all or almost all of its loans, whereas its current weighted average coupon rate sits at 13.8%. That implies a potential drop in coupon income of about 13%, but that does not include the various fees that bring the current effective yield on loans to 16.0%.
Also, about 1/3rd of TRIN’s debt is floating rate, so TRIN’s balance sheet will also benefit from a lower Fed Funds Rate.
The quarterly dividend of $0.51 was only barely covered by the $0.53 of NII per share in Q2 2024, but NII should rise in the coming quarters as a result of a spate of new loans recently completed. Management grew the share count by over 7% quarter-over-quarter, and not all of the funds from newly issued shares had been put to work yet by the end of Q2.
All in all, TRIN is by no means a low-risk investment, but its loan portfolio and credit loss history are better than you’d expect, and its internal management team (some of whom have been buying TRIN stock recently) appear to be highly aligned with shareholders.
I think the nearly 15% dividend yield is enough compensation for the level of risk investors are taking with TRIN.
While it’s still early days for this BDC, I think TRIN is shaping up to be an… out of this world… investment.
Alright, that was terrible. I’m signing off.
Read the full article here


