This is a follow-up to the April 24th article: “Are Asset Managers Still Short?” The April article pointed out that dealers in S&P 500 stock futures were long by 58%, which strongly suggested prices were about to move higher. That proved correct. This article will update the numbers.
Dealers Short or Long?
How many traders are short or long S&P 500 futures provides insight into what investors are thinking about the stock market. The tendency of future traders to be short term in their trading can be overcome by measuring longer term metrics of their activity. There’s a big difference if they short the market for a day versus shorting the market every day for three weeks, so we only measure their long term investment activity.
The Commodities Futures Trading Commission provides weekly data on the long and short positions of dealers, money managers, hedgers, and small investors. We monitor the activity of each group.
History shows your investment position should be opposite the money managers. When managers have high short positions you want to be long the market and when they have low short positions you want to sell.
In general, investors want to follow what the dealers are doing since history shows their investment position is usually right. You want to be long the market when the dealers are long and sell the market when their long positions are low.
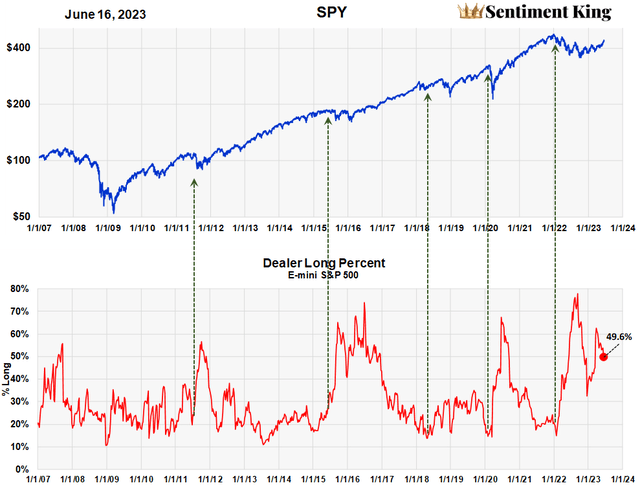
The next two charts highlight this. The first chart shows the percent that dealers are long the S&P 500. It ranges from a high of 75% long to a low of 10% long.

% Dealers are Long S&P 500 E-mini Futures (Sentiment King)
Last autumn we wrote an article highlighting the fact that dealer positions were 75% long. This was a record amount and it was our opinion this was forecasting the end of the bear market and that higher prices were ahead.
Then in April, when the ratio was 60%, we wrote another positive article. Currently, the ratio is 49.6% long, which is still historically high as you can see from the chart.
Since 2007, we’ve never seen a major market decline start without the dealer long position at 20% or less. We’ve highlighted with black arrows these key moments. You have the ratio at or below 20% and not have a market top, but no decline has started without the ratio being 20% or less.
The current ratio of 49.6% is far above 20%. This gives us confidence we’re not at a market top and, in our opinion, it’s a strong indicator for a continuation of the current rally. We could have a market decline of 5% but, unless something unexpected happens, we don’t think prices can decline much more than that.
Dealers Are Heavily Long
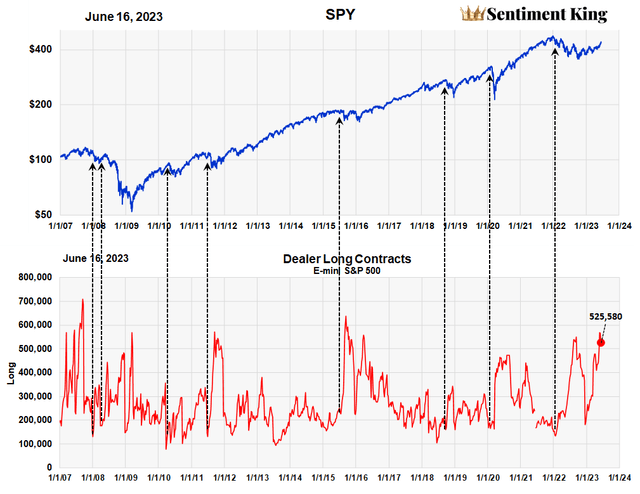
The previous graph was the percentage of long positions by dealers but we also want to show you the absolute number of long contracts owned dealers, which gives us another view of the situation.

Actual Number of Contracts Dealers are Long the E-mini S&P 500 Futures (Sentiment King)
Currently, dealers are long 525,580 contracts of the S&P 500 E-mini. This is close to the highest number on record as you can see in the chart above. Since 2007 there has never been a major decline that started with dealers holding this many long contracts.
The graph shows that major tops in the market only occur when the number of long dealer contracts is has dropped under 250,000. We are currently over double this number.
We feel this is another strong confirmation that the market advance will continue to even higher levels.
Key Point
Investment activity by dealers in S&P 500 futures continues to suggest there is little risk of a major price decline at this time and that the current rally that began last October has farther to go.
Read the full article here


