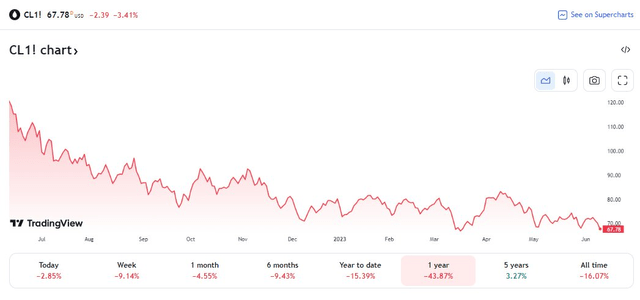
Oil prices are down sharply over the last year. Recall mid-June 2022: Tensions between Russia and Ukraine were high, commodities were on fire, and prices at the pump had soared to $5 per share. It was a great time, though, for oil & gas companies.
While early 2022 was a boon period for the SPDR S&P Oil & Gas Equipment & Services ETF (NYSEARCA:XES) components, it has been a different story in the first half of this year. WTI is now down 44% over the last 52 weeks, and energy equities are the next to last worst sector in the S&P 500 YTD.
With a low valuation and general uptrend, though, I have a buy rating on the fund. Let’s outline why.
Oil Slick: From $130 to Under $70
TradingView
According to the issuer, XES seeks to provide exposure to the oil and gas equipment and services segment of the S&P TMI, which comprises the Oil & Gas Drilling sub-industry and the Oil & Gas Equipment & Services sub-industry. Following the total return performance of that niche, XES employs a modified equal-weighted approach which offers the potential for unconcentrated industry exposure across large, mid and small-cap stocks. This fund is commonly used by investors to express either a long-term strategic view or a short-term tactical play on the oil & gas space.
XES features an annual expense ratio of just 0.35% and has a fund inception of June 2006. It holds 33 individual equities with a weighted average forward price-to-earnings multiple of only 10.35. Investors should understand that XES’s modified equal-weight methodology means the weighted average market cap size of the holdings is somewhat low at just $8.5 billion as of June 9, 2023. More exposure to small and mid-sized companies also means the yield is lower than a large-cap-dominated Energy sector fund. The dividend rate on XES is barely above 0%.
Tradeability is decent, but not overly strong with XES. The 30-day median bid/ask spread is nine basis points, while typical volume is soft at just 138,000 shares. That equates to roughly $10 million in daily dollar volume. Investors should use limit orders during periods of light liquidity.
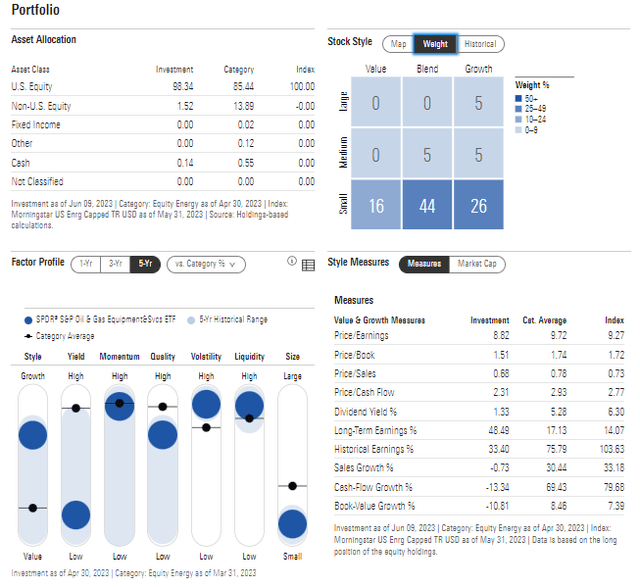
Digging into the portfolio, Morningstar’s Style Box reveals that XES is indeed oriented to small caps. Fully 85% of the allocation is considered small, while there is a slight growth bias. Among the other factors, XES features very high momentum over recent years (as evidenced by the technical chart later) while earnings quality is to the strong side even though volatility is elevated.
XES: Portfolio & Factor Profiles
Morningstar
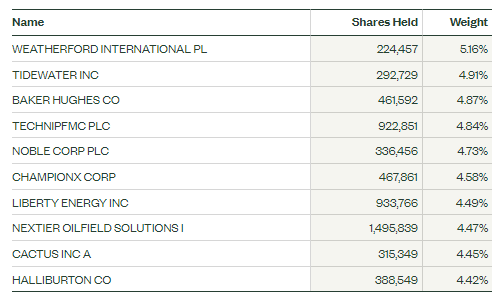
What’s ideal about the modified equal-weight construct is that no single position grows to be a very large chunk of the fund. Periodic rebalances keep risk in check. Seventy-three percent of the ETF is in the Oil & Gas Equipment & Services industry, while 27% is currently allocated to the Oil & Gas Drilling segment. Those areas are tightly correlated, however.
XES: Top 10 Holdings
SSGA Funds
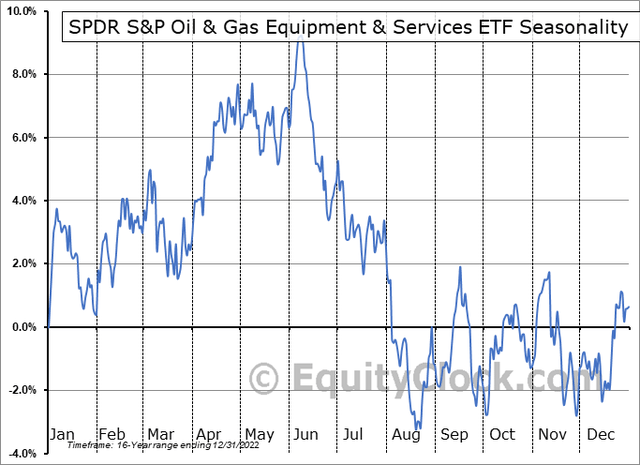
Seasonally, mid-June through mid-August tends to be a very rough stretch for XES, according to data from Equity Clock. The summer months are often fraught with volatility, so being meticulous about entering a long position over the next two months is likely a worthwhile endeavor.
XES: A Volatile Time of Year
Equity Clock
The Technical Take
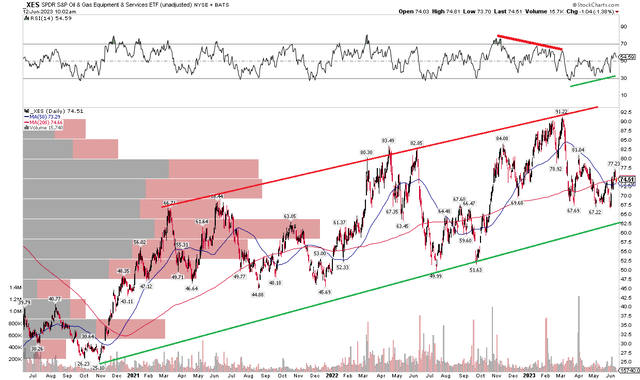
With an attractive valuation, the technical picture is also generally positive. While the group has been out of relative favor this year, it is wise to widen the scope. I see an uptrend over the past three years that has not been reversed by the bears. Notice in the chart below that XES’s long-term 200-day moving average is upward-sloping, suggesting the bulls are in charge.
Moreover, there’s been modest positive RSI divergence in the last two months as the ETF has tested near-term support in the mid-$60s. You will also see that the March high of $91 occurred on bearish momentum divergence, so it made sense that a fall would ensue, but the broader uptrend was not threatened. Buying today with a target to near $95 would make sense based on the trend. But you could also keep bearish seasonality in mind by entering a limit-buy order in the $65 to $67 zone.
XES: Momentum Shifts Here and There, But The Uptrend Continues
Stockcharts.com
Bonus Chart
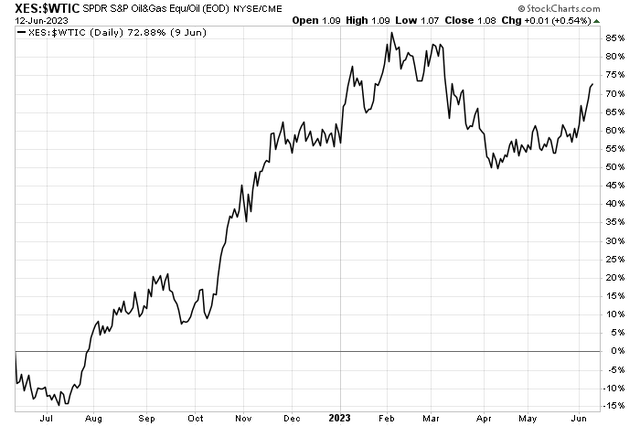
For years, XES had underperformed the spot price of domestic crude oil. I noticed lately, though, that oil & gas stocks have been moving higher compared to WTI in the last 11 months. The relative chart below comparing XES to crude oil shows that there’s been a preference for equities over the commodity. This tells me as a technician that the trend favoring XES is likely to persist. Moreover, after a February-March dip, the trend has resumed higher. I assert we could see new highs in the XES vs WTI chart as 2023 progresses.
Energy Stocks > Crude Oil Since Q3 Last Year
Stockcharts.com
The Bottom Line
I have a buy rating on XES. Its very low valuation and earnings growth are fundamental catalysts for upside, while the technical outlook is bullish amid its steady uptrend. The risk is that the fund drifts lower during the often-volatile summer stretch.
Read the full article here


